
Introduction
With fileless malware becoming a ubiquitous feature of most modern Red Teams, knowledge in the domain of memory stealth and detection is becoming an increasingly valuable skill to add to both an attacker and defender’s arsenal. I’ve written this text with the intention of further improving the skill of the reader as relating to the topic of memory stealth on Windows for both designing and defending against such malware. First by introducing my open source memory scanner tool Moneta (on Github here) and, second, by exploring the topic of legitimate dynamic code allocation, false positives and the stealth potential therein discovered through use of this scanner.
This is the second in a series of posts on malware forensics and bypassing defensive scanners, part one of which can be found here. It was written with the assumption that the reader understands the basics of Windows internals, memory scanners and malware design.
Moneta
In order to conduct this research I wrote a memory scanner in C++ that I’ve named Moneta. It was designed both as an ideal tool for a security researcher designing malware to visualize artifacts relating to dynamic code operations, as well as a simple and effective tool for a defender to quickly pick up on process injections, packers and other types of malware in memory. The scanner maps relationships between the PEB, stack, heaps, CLR, image files on disk and underlying PE structures with the regions of committed memory within a specified process. It uses this information to identify anomalies, which it then uses to identify IOCs. It does all of this without scanning the contents of any of the regions it enumerates, which puts it in stark contrast to tools such as pe-sieve, which is also a usermode/runtime memory IOC scanner, but which relies on byte patterns in addition to memory characteristics as its input. Both Moneta and pe-sieve have the shared characteristic of being usermode scanners designed for runtime analysis as opposed to tools based on the Volatility framework that rely on kernel objects and are generally intended to be used retrospectively on a previously captured memory dump file.
Moneta focuses primarily on three areas for its IOCs. The first is the presence of dynamic/unknown code, which it defines as follows:
- Private or mapped memory with executable permissions.
- Modified code within mapped images.
- PEB image bases or threads with start addresses in non-image memory regions.
- Unmodified code within unsigned mapped images. This is a soft indicator for hunting, not a malware IOC.
Secondly, Moneta focuses on the suspicious characteristics of the mapped PE image regions themselves:
- Inconsistent executable permissions between a PE section in memory and its counterpart on disk. For example, a PE with a section that is +RX in memory, but marked for +R in its PE header on disk.
- Mapped images in memory with modified PE headers.
- Mapped images in memory whose FILE_OBJECT attributes cannot be queried. This is an indication of phantom DLL hollowing.
Thirdly, Moneta looks at IOCs as they relate to the process itself:
- The process contains a mapped image whose base address does not have a corresponding entry in the PEB.
- The process contains a mapped image whose base address corresponds to an entry in the PEB but whose name or path (as derived from its FILE_OBJECT) do not match those in the PEB entry.
To illustrate the attribute-based approach to IOCs utilized by Moneta, a prime example can be found in the first part of this series where classic as well as phantom DLL hollowing were described in detail and given as examples of lesser known and harder to detect alternatives to classic dynamic code allocation. The latter technique of phantom DLL hollowing was fully undetected by all (publicly) existing scanners at the time the post was written. In the example below, I’ve pointed Moneta at a process containing a classic DLL hollowing artifact used in conjunction with a shellcode implant.
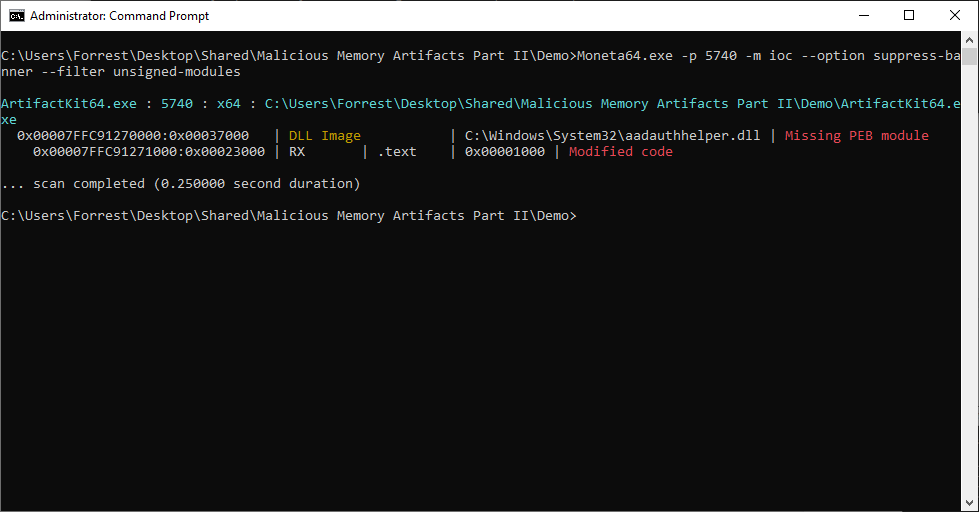
The module aadauthhelper.dll at 0x00007FFC91270000 associated with the triggered IOC can be further enumerated by changing the selection type of Moneta from suspicious to region and providing the exact address to select. The from-base option enumerates the entire region (from its allocation base) associated with specified address, not only its subregion (VAD).
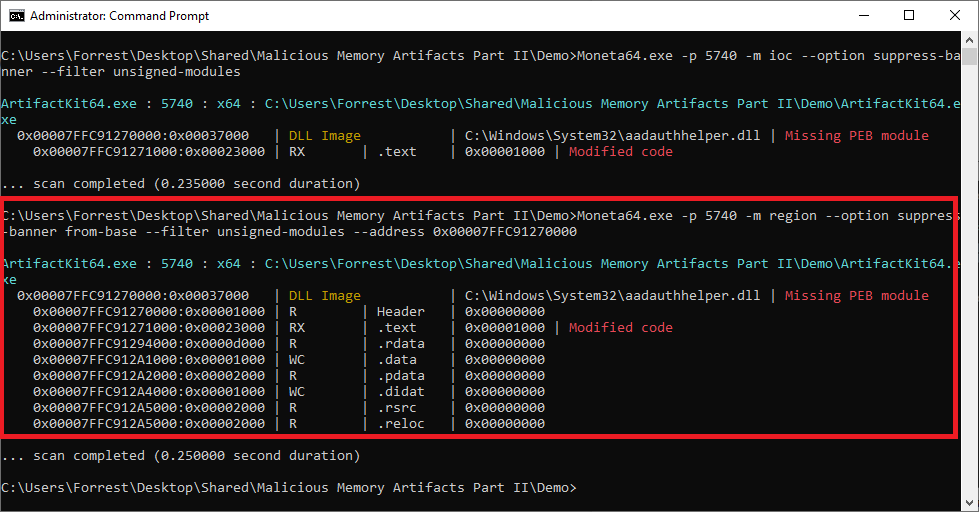
The two suspicions in Figure 2 illustrate the strategy used by Moneta to detect DLL hollowing, as well as other (more common) malware stealth techniques such as Lagos Island (a technique often used to bypass usermode hooks). The aadauthhelper.dll module itself, having been mapped with NTDLL.DLL!NtCreateSection and NTDLL.DLL!NtMapViewOfSection as opposed to legitimately using NTDLL.DLL!LdrLoadDll, lacks an entry in the loaded modules list referenced by the PEB. In the event that the module had been legitimately loaded and added to the PEB, the shellcode implant would still have been detected due to the 0x1000 bytes (1 page) of memory privately mapped into the address space and retrieved by Moneta by querying its working set – resulting in a modified code IOC as seen above.
The C code snippet below, loosely based upon Moneta, illustrates the detection of classic DLL hollowing through the use of both PEB discrepancy and working set IOCs:
uint8_t *pAddress = ...
MEMORY_BASIC_INFORMATION Mbi;

if (VirtualQueryEx(hProcess, pAddress, &Mbi, sizeof(MEMORY_BASIC_INFORMATION)) == sizeof(MEMORY_BASIC_INFORMATION)) {
  if(Mbi.Type == MEM_IMAGE && IsExecutable(&Mbi)) {
    wchar_t ModuleName[MAX_PATH + 1] = { 0 };

    if (!GetModuleBaseNameW(hProcess, (static_cast<HMODULE>(Mbi.AllocationBase), ModuleName, MAX_PATH + 1)) {
      // Detected missing PEB entry...
    }

    if (Mbi.State == MEM_COMMIT && Mbi.Protect != PAGE_NOACCESS) {
      uint32_t dwPrivateSize = 0;
      PSAPI_WORKING_SET_EX_INFORMATION WorkingSets= { 0 };
      uint32_t dwWorkingSetsSize = sizeof(PSAPI_WORKING_SET_EX_INFORMATION);

      for (uint32_t dwPageOffset = 0; dwPageOffset < Mbi.RegionSize; dwPageOffset += 0x1000) {
        WorkingSets.VirtualAddress = (static_cast<uint8_t *>(Mbi.BaseAddress) + dwPageOffset);

        if (K32QueryWorkingSetEx(this->ProcessHandle, &WorkingSets, dwWorkingSetsSize)) {
          if (!WorkingSets.VirtualAttributes.Shared) {
            dwPrivateSize += 0x1000;
          }
        }
      }

      if(dwPrivateSize) {
        // Detected modified code...
      }
    }
  }
}
In the example below, I’ve pointed Moneta at a process containing a phantom DLL hollowing artifact used in conjunction with a shellcode implant.
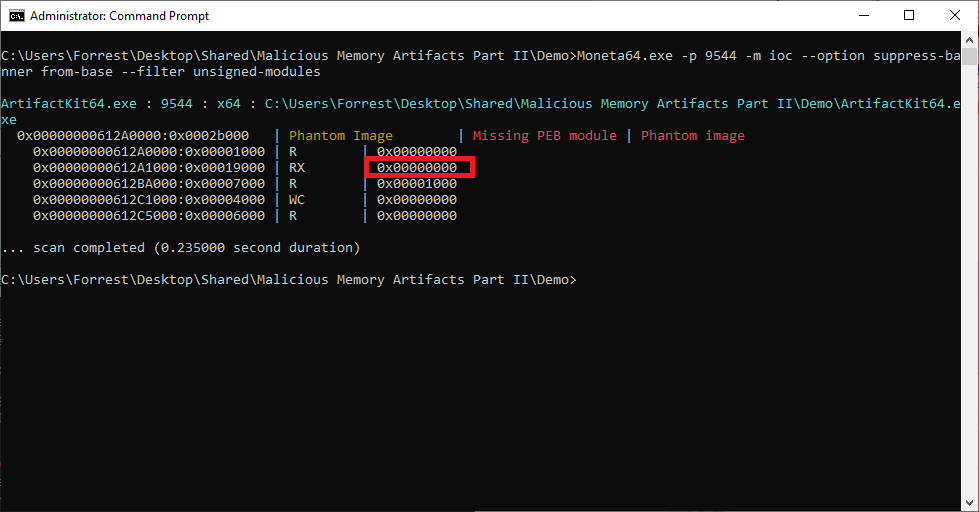
Notably, in the image above, the missing PEB module suspicion persists (since the region in question is technically image memory without a corresponding PEB module entry) but the image itself is unknown. This is because TxF isolates its transactions from other processes, including, in this case, Moneta. When attempting to query the name of the file associated with the image region from its underlying FILE_OBJECT using the PSAPI.DLL!GetMappedFileNameW API, external processes will fail in the unique instance that the section underlying the image mapping view was generated using a transacted handle created by an external process. This is the most robust method I’ve devised to reliably detect phantom DLL hollowing and process doppelganging. This also results in the inability of the subregions of this image mapping region (distinguished by their unique VAD entries in the kernel) to be associated with PE sections as they are in Figure 2. Notably, phantom DLL hollowing has done a very nice job of hiding the shellcode implant itself. In the highlighted region of Figure 4 above, the private bytes associated with the region (which should be 0x1000, or 1 page, due to the shellcode implant) is zero. There is no other method I am aware of powerful enough to hide modified ranges of executable image memory from working set scans. This is why the Moneta scan of the classic DLL hollowing artifact process seen in Figure 2 yields a “modified code” suspicion, while phantom DLL hollowing does not.
The code snippet below, loosely based upon Moneta, illustrates the detection of phantom DLL hollowing through TxF file object queries:
uint8_t *pAddress = ...
MEMORY_BASIC_INFORMATION Mbi;

if (VirtualQueryEx(hProcess, pAddress, &Mbi, sizeof(MEMORY_BASIC_INFORMATION)) == sizeof(MEMORY_BASIC_INFORMATION)) {
  if(Mbi.Type == MEM_IMAGE) {
    wchar_t DevFilePath[MAX_PATH + 1] = { 0 };

    if (!GetMappedFileNameW(hProcess, static_cast<HMODULE>(Mbi.AllocationBase), DevFilePath, MAX_PATH + 1)) {
      // Detected phantom DLL hollowing...
    }
  }
}
Filters and False Positives
With an understanding of the IOC criteria described in the previous section, a scan of my full Windows 10 OS would be expected to yield no IOCs, yet this is far from the reality in practice.
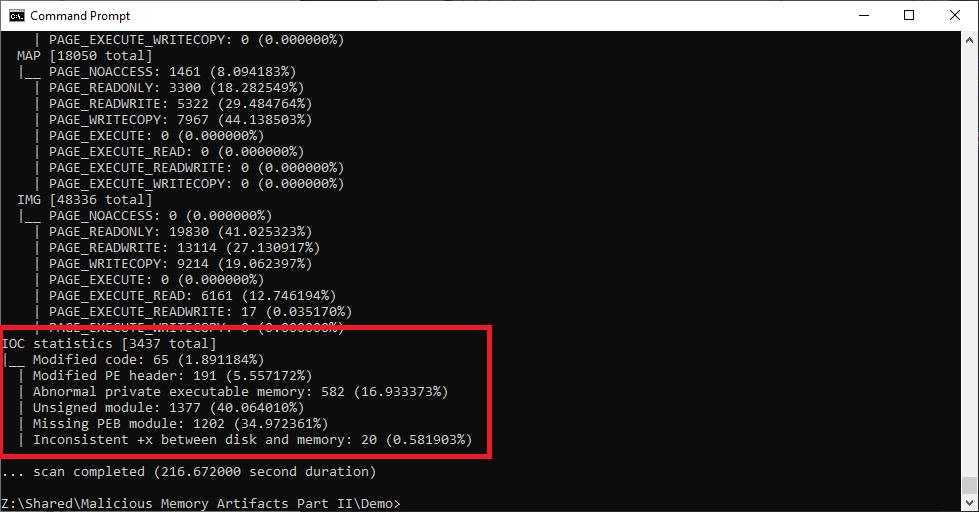
With an astounding 3,437 IOCs on a relatively barren Windows 10 OS, it quickly becomes clear why so many existing memory scanners rely so heavily on byte patterns and other less broad IOC criteria. I found these results fascinating when I first began testing Moneta and I discovered many quirks, hidden details and abnormalities inherent to many subsystems in Windows that are of particular interest when designing both malware and scanners.
Let’s begin by examining the 1202 missing PEB module IOCs. These IOCs are only generated when a PE is explicitly mapped into a process as an image using SEC_IMAGE with NTDLL.DLL!NtCreateSection and is not added to the loaded modules list in the PEB –something which would be done automatically if the PE had been loaded in the way it is supposed to be loaded via NTDLL.DLL!LdrLoadDll.
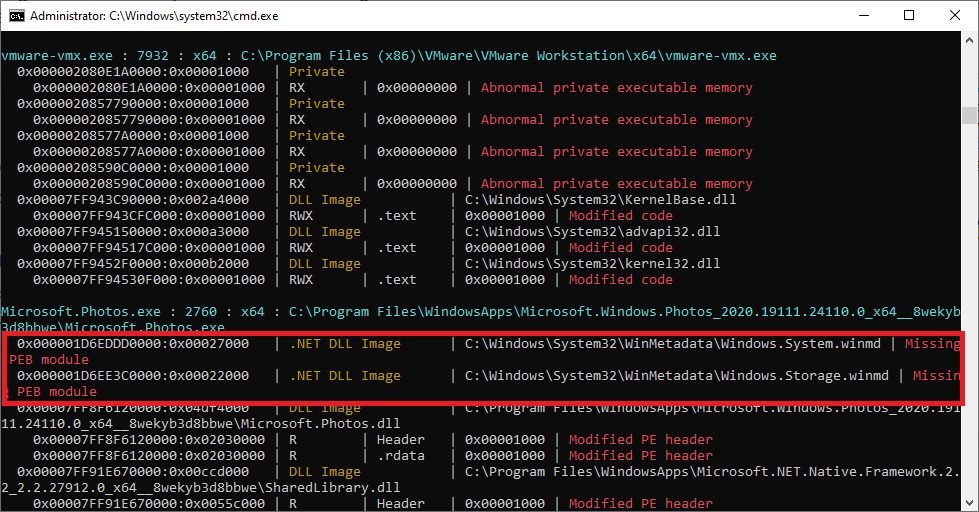
The region at 0x000001D6EDDD0000 corresponds to the base of a block of image memory within an instance of the Microsoft.Photos.exe process. At a glance, it shares characteristics in common with malicious DLL hollowing and Lagos Island artifacts. Further details of this region can be obtained through a subsequent scan of this exact address with a higher detail verbosity level.
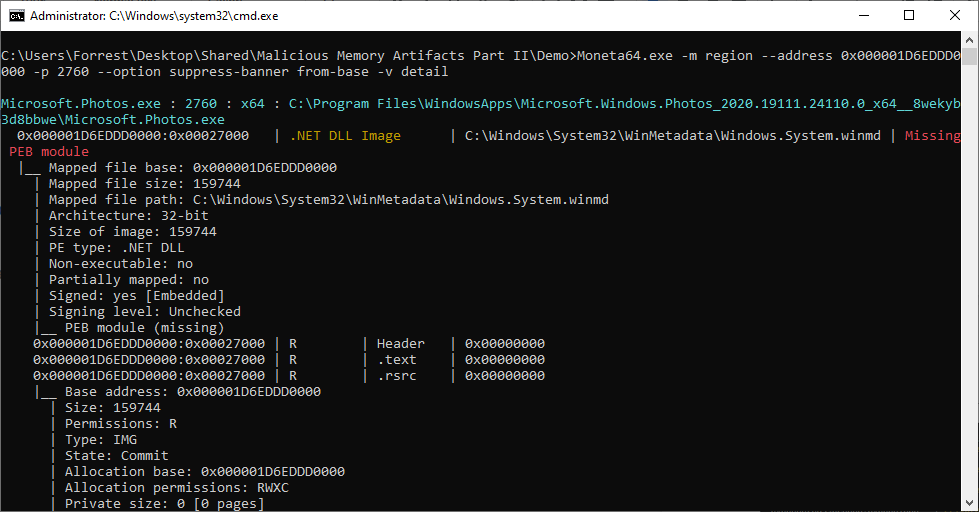
There are several interesting characteristics of this region. Prime among them, is the Non-executable attribute (queried through the NTDLL.DLL!NtQueryVirtualMemory API) set to false despite this image clearly not having been loaded with the intention of executing code. Non-executable image regions are a unique and undocumented feature of the NNTDLL.DLL!NtCreateSection API, which causes the resulting image to be immutably readonly but still of type MEM_IMAGE. Furthermore, use of the SEC_IMAGE_NO_EXECUTE flag when creating new sections allows for a bypass of the image load notification routine in the kernel. We would expect such a feature to have been used in the case of this metadata file, but it was not. There is a single VAD associated with the entire region with PTE attributes of read-only even though the image was clearly loaded as a regular executable image (also evidenced by the initial permissions of PAGE_EXECUTE_WRITECOPY) and contains a .text section that would normally contain executable code.
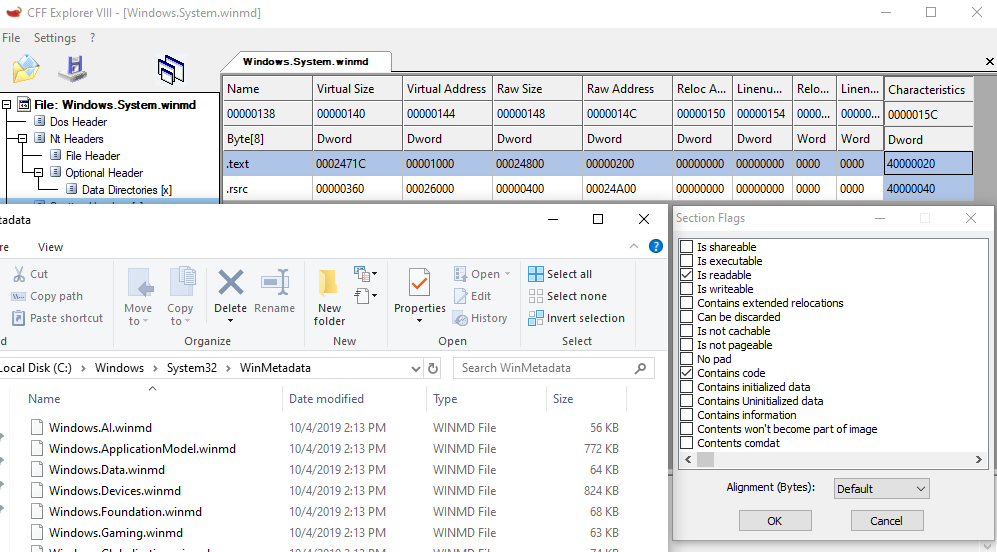
As its name implies, this does appear to be a genuine metadata file which was not ever intended to be executed (despite being a valid PE, being loaded as an executable image and containing a .text section).
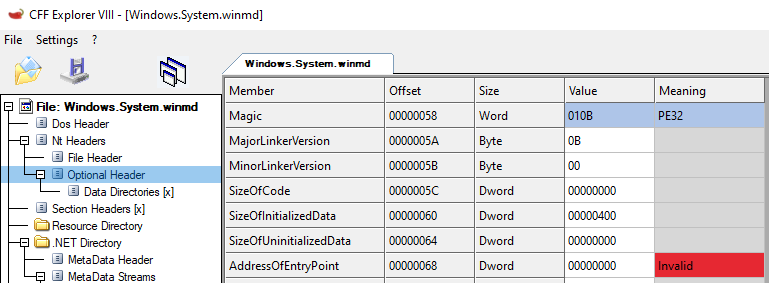
The image above provides a definitive confirmation of the fact that this is a PE file which was never meant to execute: its IMAGE_OPTIONAL_HEADER.AddressOfEntryPoint is zero. With no entry point and no exports, there are no conventional methods of executing this DLL, which explains why it was manually mapped in a way which made it appear to be a malicious DLL hollowing or Lagos Island artifact.
Combining the criteria explored above, a filter rule was created within Moneta which removes “missing PEB module” IOCs associated with signed Windows metadata files with blank entry points. This methodology was repeated throughout the development of the scanner to eliminate false positives from its IOCs.
Windows metadata files are not alone in imitating Lagos Island IOCs: standard .NET assemblies have this same IOC as well, as they are not loaded via NTDLL.DLL!LdrLoadDll, but, rather, are directly mapped using NTDLL.DLL!NtCreateSection with SEC_IMAGE. The exception to this rule is Native Image Generated (NGEN) .NET assemblies, which are loaded as standard native DLLs and therefore have corresponding links in the PEB. This phenomenon was first observed by Noora Hyvärinen of F-Secure in their post examining detection strategies for malicious .NET code.
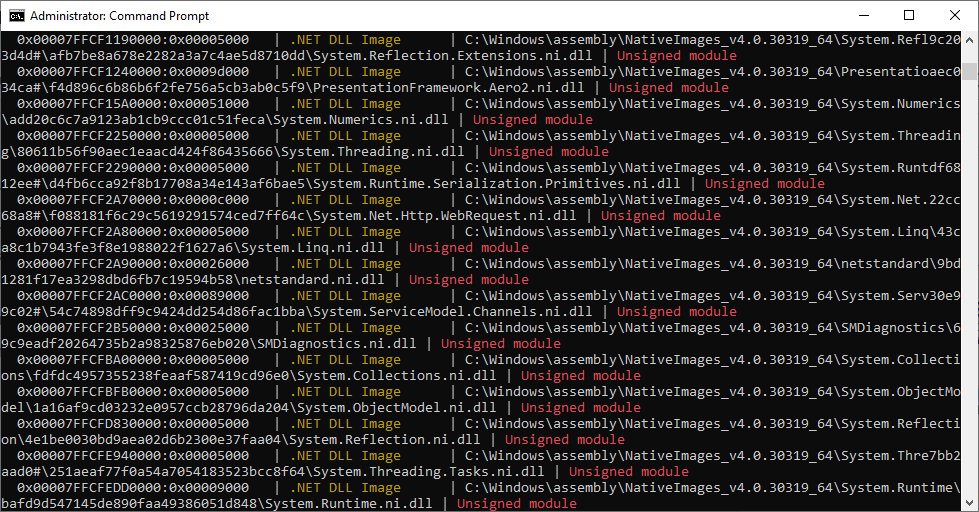
Another interesting detail of the statistics gathered in Figure 4 are the 1377 unsigned modules, a total of about 40% of all IOCs on the OS. This large number is certainly inconsistent with what one would expect: for unsigned modules to be rarities associated exclusively with unsigned third party applications. In reality, the vast majority of these unsigned images are derived from Microsoft DLLs, specifically, .NET NGEN assemblies. This is consistent with the concept of these DLLs being built dynamically, to eliminate the need for the conversion of CIL to native code by JIT at runtime.
Shifting focus to other categories of IOC, another interesting genre appears as inconsistent +x between disk and memory at a total of 16 (7%) of the now drastically reduced IOC total of 222.
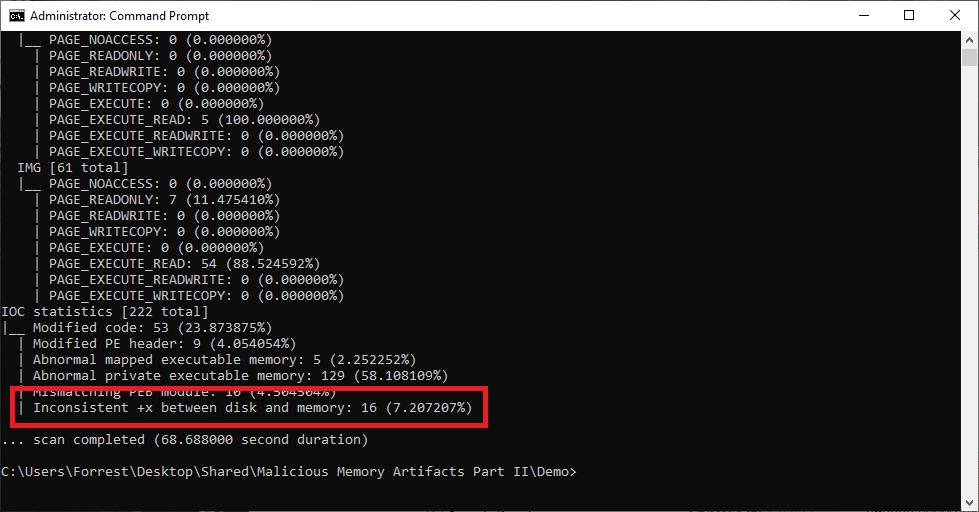
Interestingly, the number 16 also matches the total number of Wow64 processes on the scanned OS. A further investigation yields the answer to why.
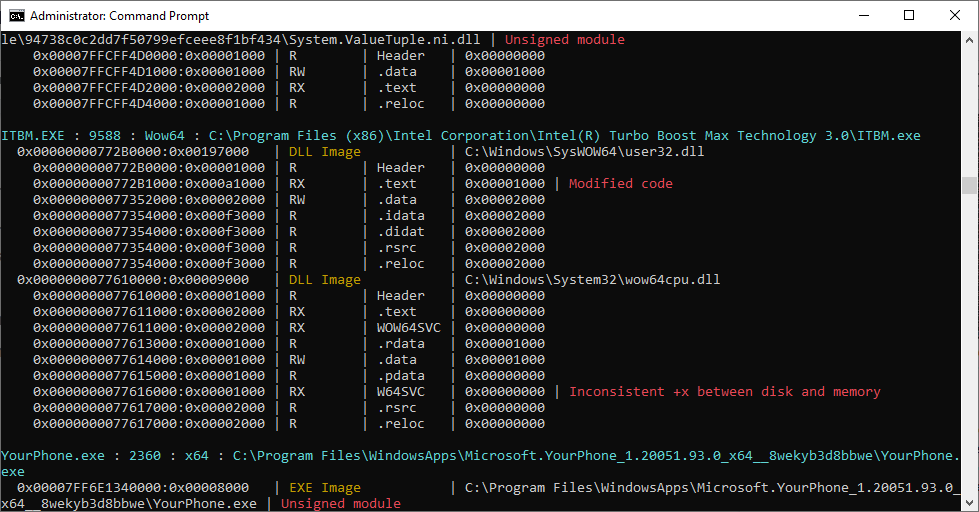
Wow64cpu.dll is a module which is loaded into every Wow64 process in order to help facilitate the interaction between the 32-bit code/modules and 64-bit code/modules (Wow64 processes all have both 32 and 64-bit DLLs in them). Checking the PE section attributes of the W64SVC section in Wow64cpu.dll on disk, we can see that it should be read-only in memory.
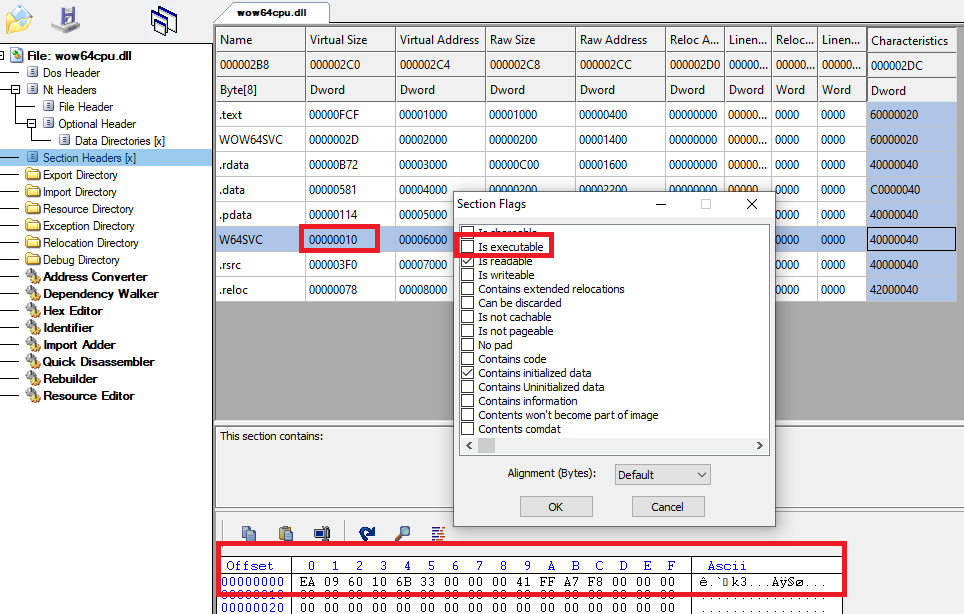
Another very interesting detail of the W64SVC section is that it contains only 0x10 bytes of data and is not modified after having its permissions changed from +R to +RX by Windows. This means that the content of the W64SVC section seen in Figure 12 is meant to be executed at runtime as it appears on disk. The first byte of this region, 0xEA, is an intersegment far CALL instruction, the use of which is typically limited to x86/x64 mode transition in Wow64 processes (an attribute which is exploited by the classic Heaven’s Gate technique).
Both the modified code within User32.dll (as well as occasionally the 32-bit version of Kernel32.dll) and the inconsistent permission IOCs seen in Figure 11 are consistent side-effects of Wow64 initialization.
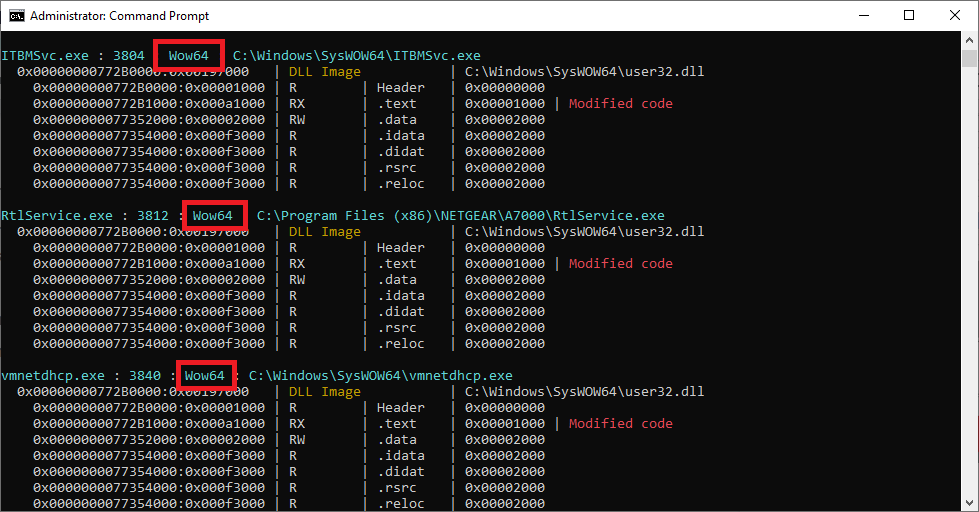
They are actions taken at runtime by Windows, in both cases by manually changing the permissions of the .text and W64SVC sections using NTDLL.DLL!NtProtectVirtualMemory. A filter for both of these IOCs called wow64-init exists in Moneta.
While there are many such false positives, many of which cannot be discussed here due to time and space constraints, my conclusion is that they are distinctly finite. With the exception of third party applications making use of usermode hooks, the IOCs that trigger false positives in Moneta are the result of specific subsystems within Windows itself and with sufficient time and effort can be universally eliminated through whitelisting.
Dynamic Code
Windows contains a seldom discussed exploit mitigation feature called Dynamic Code Prevention. It is one of many process mitigation policies (most commonly known for DEP, ASLR and CFG) which makes its host process unable to “generate dynamic code or modify existing executable code.” In practice this translates to a restriction on the NTDLL.DLL!NtAllocateVirtualMemory, NTDLL.DLL!NtProtectVirtualMemory and NTDLL.DLL!NtMapViewOfSection APIs. In essence, it prevents all code that is not loaded via the mapping of a section created with the SEC_IMAGE flag from being allocated in the first place when the PAGE_EXECUTE permission is requested. It also prevents the addition of the PAGE_EXECUTE permission to any existing memory region regardless of its type. This information illustrates that Microsoft has its own definition of dynamic code and considers this definition sufficient for an exploit mitigation policy. Moneta, whose primary mechanism for creating IOC is the detection of dynamic code is based upon this same definition. In theory a combination of DPC and Code Integrity Guard (which prevents any unsigned image section from being mapped into the process) should make it impossible to introduce any unsigned code into memory, as there are only several ways to do so:
- Allocating private or mapped memory as +RWX, writing code to it and executing. This technique is mitigated by DPC.
- Allocating or overwriting existing private or mapped memory as +RW, writing code to it and then modifying it to be +X before executing. This technique is mitigated by DPC.
- Overwriting existing image memory with code and then modifying it to be +X before executing. This technique is mitigated by DPC.
- Writing the code in the form of a PE file to disk and then mapping it into the process as an image. This technique is mitigated by Code Integrity Guard.
- Recycling an existing +RWX region of mapped, image or private memory. Such memory regions can be considered to be pre-existing dynamic code.
- Phantom DLL hollowing, which is the only technique which is capable of bypassing DPC and CIG if there is no existing +RWX region available to recycle. Credit is due to Omer Yair, the Endpoint Team Lead at Symantec, for making me aware of this potential use of phantom DLL hollowing in exploit writing.
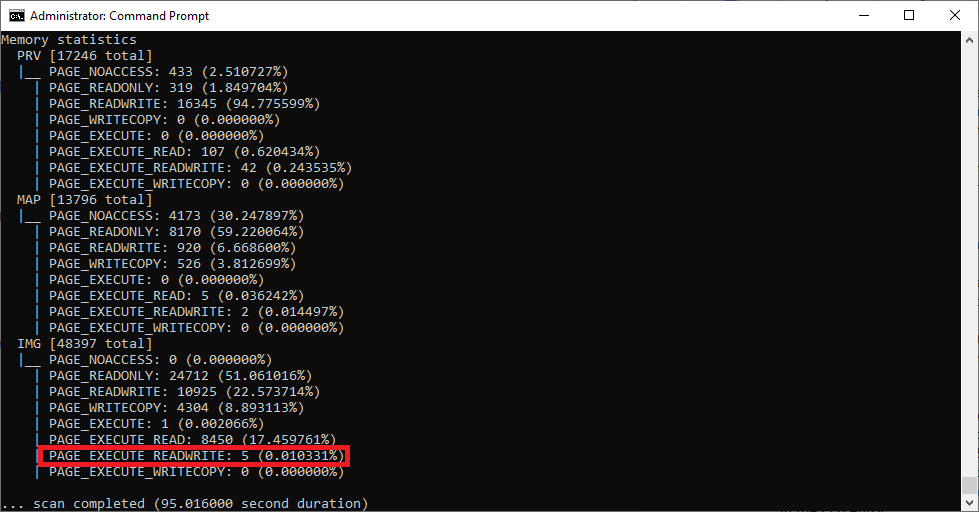
The remainder of this section will focus on the topic of recycling existing +RWX regions of dynamic code. While the pickings are relatively sparse, there are consistent phenomena within existing Windows subsystems that produce such memory. Those who remember the first post of this series may see this statement as a contradiction of one of the fundamental principles it was based upon, namely that legitimate executable memory within the average process is exclusively the domain of +RX image mappings associated with .text sections. Time has proven this assertion to be false and Moneta clearly demonstrates this when asked to provide statistics on memory region types and their corresponding permissions on a Windows 10 OS.
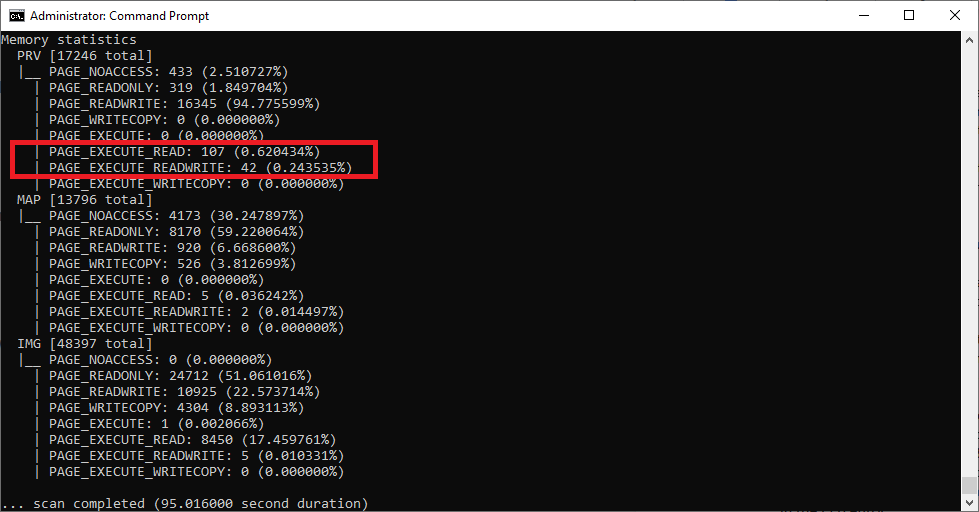
Although this executable private memory accounts for less than 1% of the total private memory in all processes on the OS, at over 200 total regions it raises an extremely interesting question: if malware is not allocating these dynamic regions of memory, then what is?
When I first began testing Moneta ,this was the question that prompted me to begin reverse engineering the Common Language Runtime (CLR). The clr.dll module, I quickly observed, was a consistent feature of every single process I encountered which contained regions of private +RWX memory. The CLR is a framework that supports managed (.NET) code within a native process. Notably, there is no such thing as a “managed process” and all .NET code, whether it be C# or VB.NET, runs within a virtualized environment within a normal Windows process supported by native DLLs such as NTDLL.DLL, Kernel32.dll, etc.
A .NET EXE can load native DLLs and vice versa. .NET PEs are just regular PEs that contain a .NET metadata header as a data directory. All of the same concepts that apply to a regular EXE or DLL apply to their .NET equivalents. The key difference is that when any PE with a .NET subsystem is loaded and initialized (more on this shortly) either as the primary EXE of a newly launched process or as a .NET DLL loaded into an existing process, it will cause a series of additional modules to be loaded. These modules are responsible for initializing the virtual environment (CLR) that will contain the managed code. I’ve created one such .NET EXE in C# targeting .NET 4.8 for demonstrative purposes.
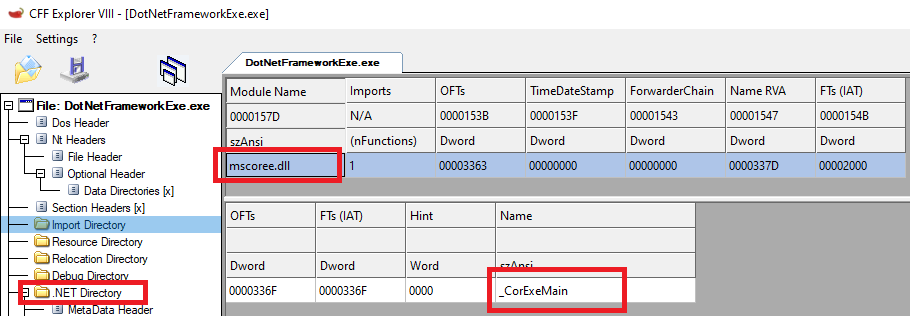
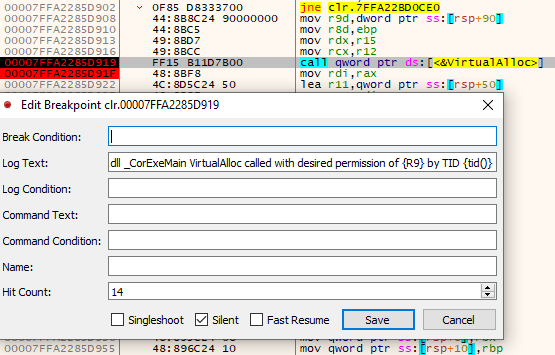
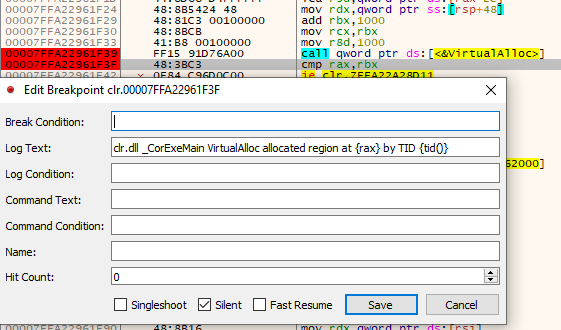
.NET PEs contain a single native import, which is used to initialize the CLR and run their managed code. In the case of an EXE this function is _CorExeMain, as seen above, and in the case of DLLs it is _CorDllMain. The native PE entry point specified in the IMAGE_OPTIONAL_HEADER.AddressOfEntryPoint is simply a stub of code that calls this import. clr.dll has its own versions of these exports, for which the _CorExeMain/_CorDllMain exports of mscoree.dll are merely wrappers. It is within _CorExeMain/_CorDllMain in clr.dll that the real CLR initialization begins and the private +RWX regions begin to be created. When I began reverse engineering this code, I initially set breakpoints on its references to KERNEL32.DLL!VirtualAlloc, of which there were two.
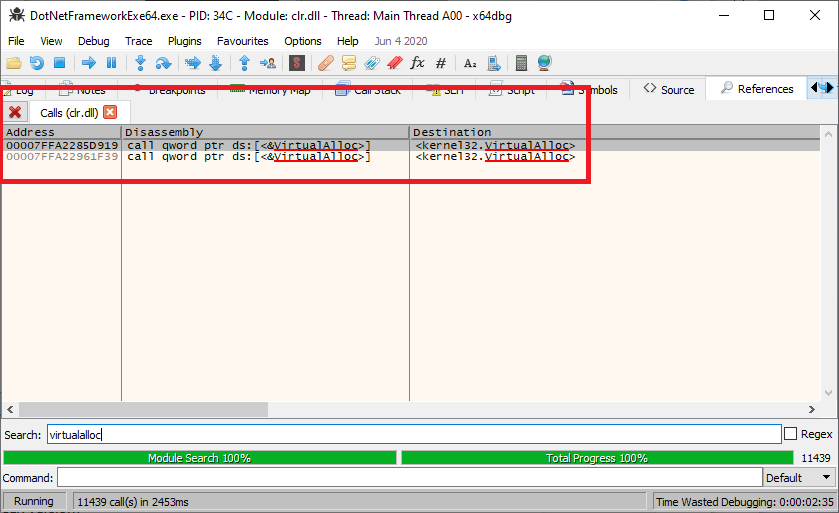
The first breakpoint records the permission that KERNEL32.DLL!VirtualAlloc is called with (since this value is dynamic, we can’t simply read the assembly and know it). This is the 4th parameter and therefore it is stored in the R9 register.
The second breakpoint records the allocated region address returned by KERNEL32.DLL!VirtualAlloc in the RAX register.
An additional four breakpoints were set on the _CorExeMain start/return addresses in both mscoree.dll and clr.dll. Beginning the trace, the logs from x64dbg gradually illustrate what happens behind the scenes when a .NET EXE is loaded.

First, the main EXE loads its baseline native modules and the primary import of mscoree.dll. At this point, the default system breakpoint is hit.
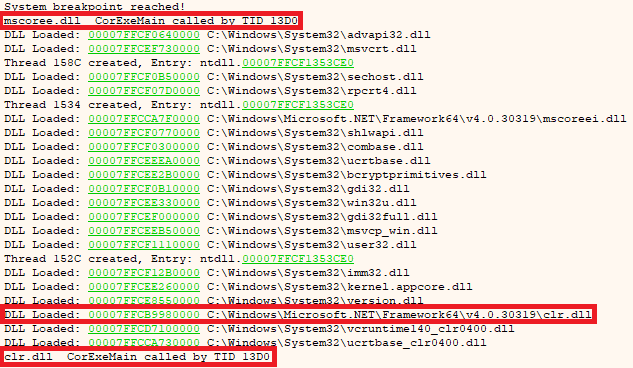
As seen in Figure 21, the primary thread of the application calls through the IMAGE_OPTIONAL_HEADER.AddressOfEntryPoint into MSCOREE.DLL!_CorExeMain, which, in turn, loads the prerequisite .NET environment modules and calls CLR.DLL!_CorExeMain.
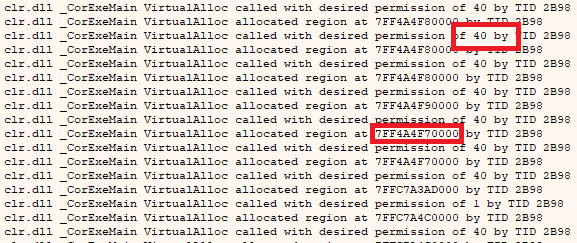
While not all of the captured VirtualAlloc calls from CLR.DLL!_CorExeMain are requesting PAGE_EXECUTE_READWRITE memory, a substantial number are, as is shown in Figure 22 above where a permission of 0x40 is being requested through the R9 register.
Enumerating the memory address space of this .NET EXE using Moneta, we can see a great deal of the +RWX memory allocated in Figure 21 appear as IOCs.
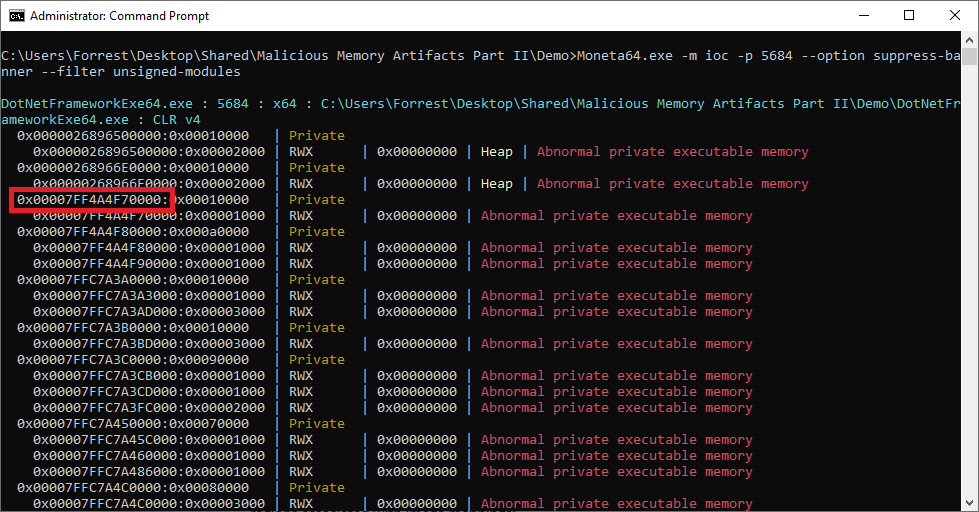
Notably, upon closer inspection, the +RWX regions shown as IOCs in the Moneta scan match those allocated by KERNEL32.DLL!VirtualAlloc from CLR.DLL!_CorExeMain (one such example is highlighted in Figures 21 and 22). There are however, two regions shown in the Moneta IOC results which do not correspond to any of the traced KERNEL32.DLL!VirtualAlloc calls. These are the two regions that appear near the top of Figure 22 with the “Heap” attribute. Searching the code of clr.dll, we can indeed see a reference to the KERNEL32.DLL!HeapCreate API.

The key detail of this stub of code is the value that ECX (the first parameter of HeapCreate) is being initialized to, which is 0x40000. This constant corresponds to the HEAP_CREATE_ENABLE_EXECUTE option flag, which will cause the resulting heap to be allocated with +RWX permissions, explaining the +RWX heaps generated as a result of CLR initialization. These native heaps, recorded in the PEB, are notably distinct from the virtual CLR heaps which are only queryable through .NET debugging APIs.
This analysis explains the origins of the private +RWX regions, but it doesn’t explain their purpose – a detail which is key to whitelisting them to avoid false positives. After all, if we can programmatically query the regions of memory associated with the .NET subsystem in a process, then we can use this data as a filter to distinguish between legitimately allocated dynamic code stemming from the CLR and unknown dynamic code to mark as an IOC. Answering this question proved to be an exceptionally time consuming part of this research and I believe some high-level details will help to enhance the knowledge of the reader in what has proven to be a very obscure and undocumented area of Windows.
Windows contains an obscure and poorly documented DLL called mscoredacwks.dll that hosts a Data Access Control (DAC) COM interface intended to allow native debugging of managed .NET code. Some cursory digging into the capabilities of these interfaces yields what appears to be promising results. One such example is the ICLRDataEnumMemoryRegions interface, which purports to enumerate all regions of memory associated with the CLR environment of an attached process. This sounds like the perfect solution to developing an automated CLR whitelist, however, in practice, this interface proved to have a remarkably poor coverage of such memory (only enumerated about 20% of the +RWX regions we observed to be allocated by CLR.DLL!_CorExeMain). Seeking an alternative, I stumbled across ClrMD, a C# library designed for the specific purpose of interfacing with the DAC and containing what appeared to be a relevant code in the form of the EnumerateMemoryRegions method of its ClrRuntime class. Furthermore, this method does not rely upon the aforementioned ICLRDataEnumMemoryRegions interface and instead manually enumerates the heaps, app domains, modules and JIT code of its target.
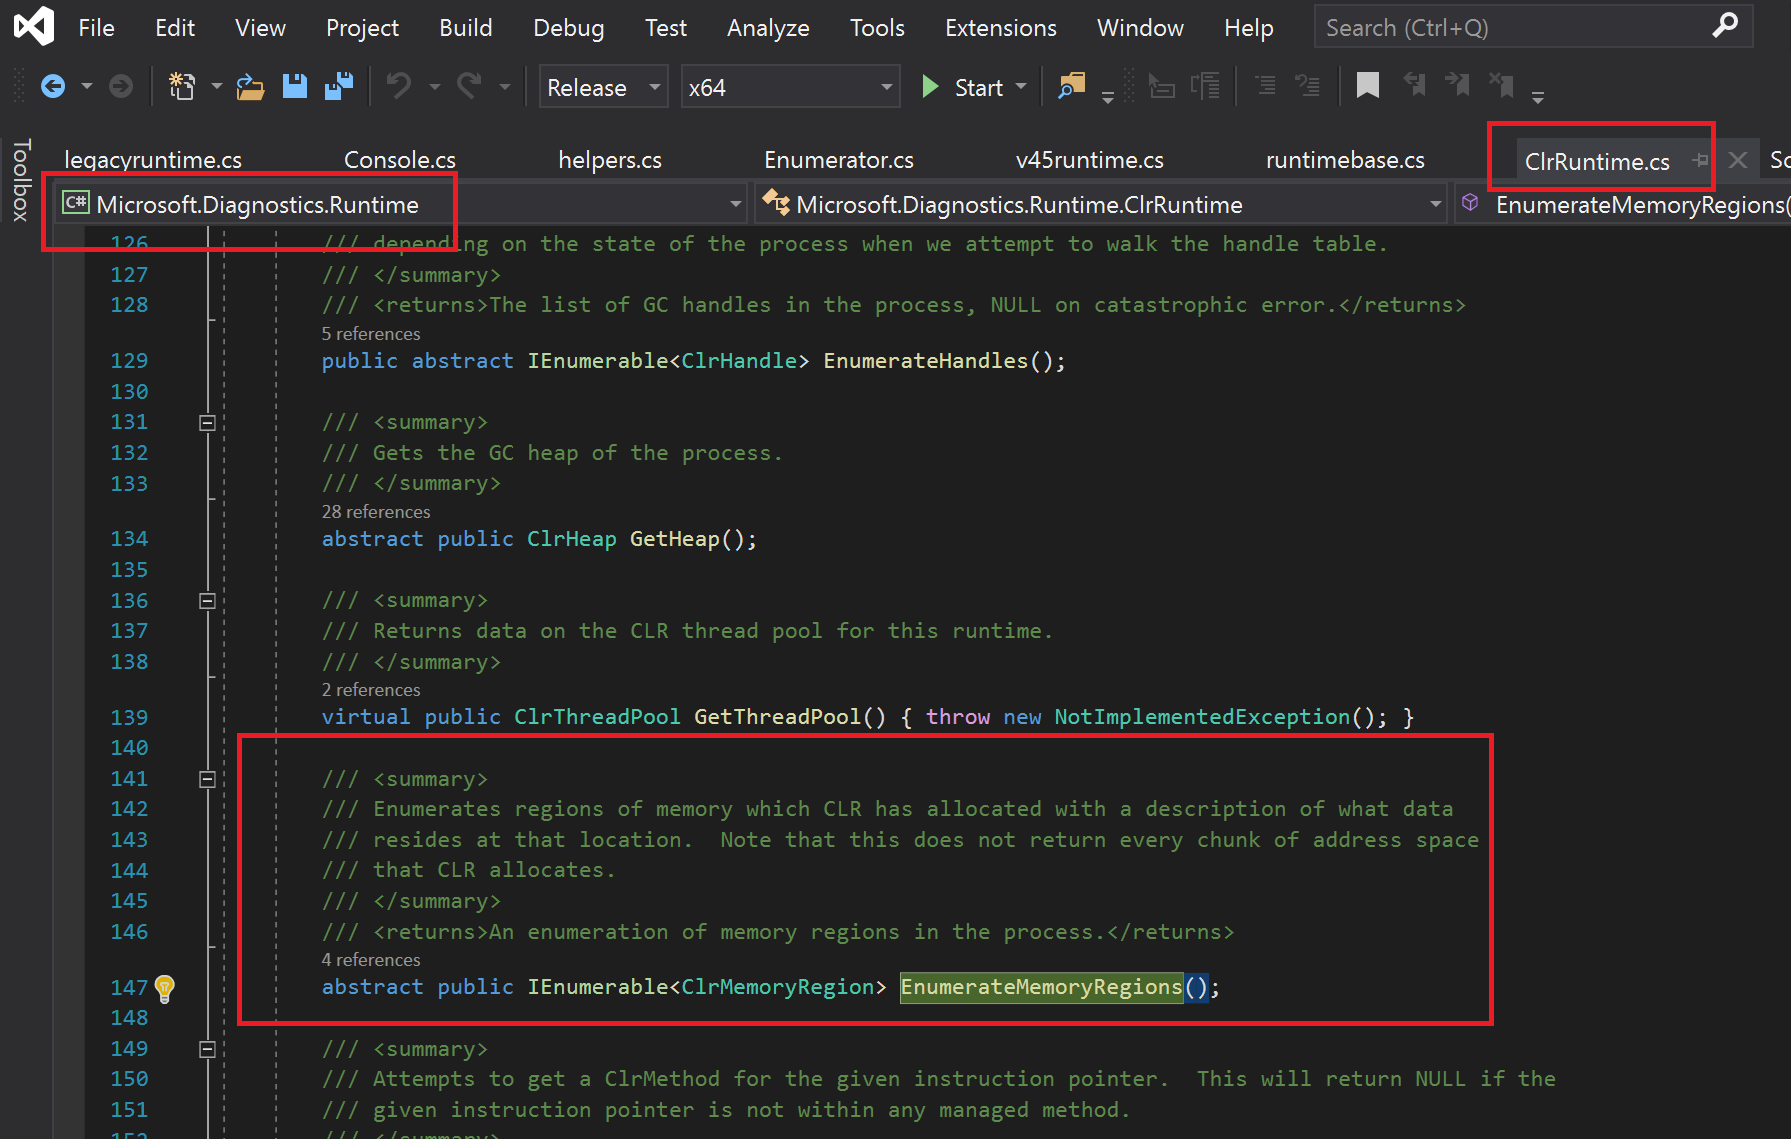
I wrote a small side project in C# (the same language as ClrMD) to interface between Moneta and the EnumerateMemoryRegions method over the command line and created a modified version of the scanner to use this code to attempt to correlate the private PAGE_EXECUTE_READWRITE regions it enumerated with the CLR heaps described prior.
ulong Address = ...

using (var dataTarget = DataTarget.AttachToProcess(Pid, 10000, AttachFlag.Invasive)) // Invasive, pausing our target process
{
  ClrInfo clrVersion = dataTarget.ClrVersions[0];
  ClrRuntime clrRuntime = clrVersion.CreateRuntime();

  foreach (ClrMemoryRegion clrMemoryRegion in clrRuntime.EnumerateMemoryRegions())
  {
    if (RegionOverlap(Address, RegionSize, clrMemoryRegion.Address, clrMemoryRegion.Size))
    {
      Console.WriteLine("... address {0:X}(+{1}) overlaps with CLR region at {2:X} - {3}", Address, RegionSize, clrMemoryRegion.Address, clrMemoryRegion.ToString(true));
    }
  }
}
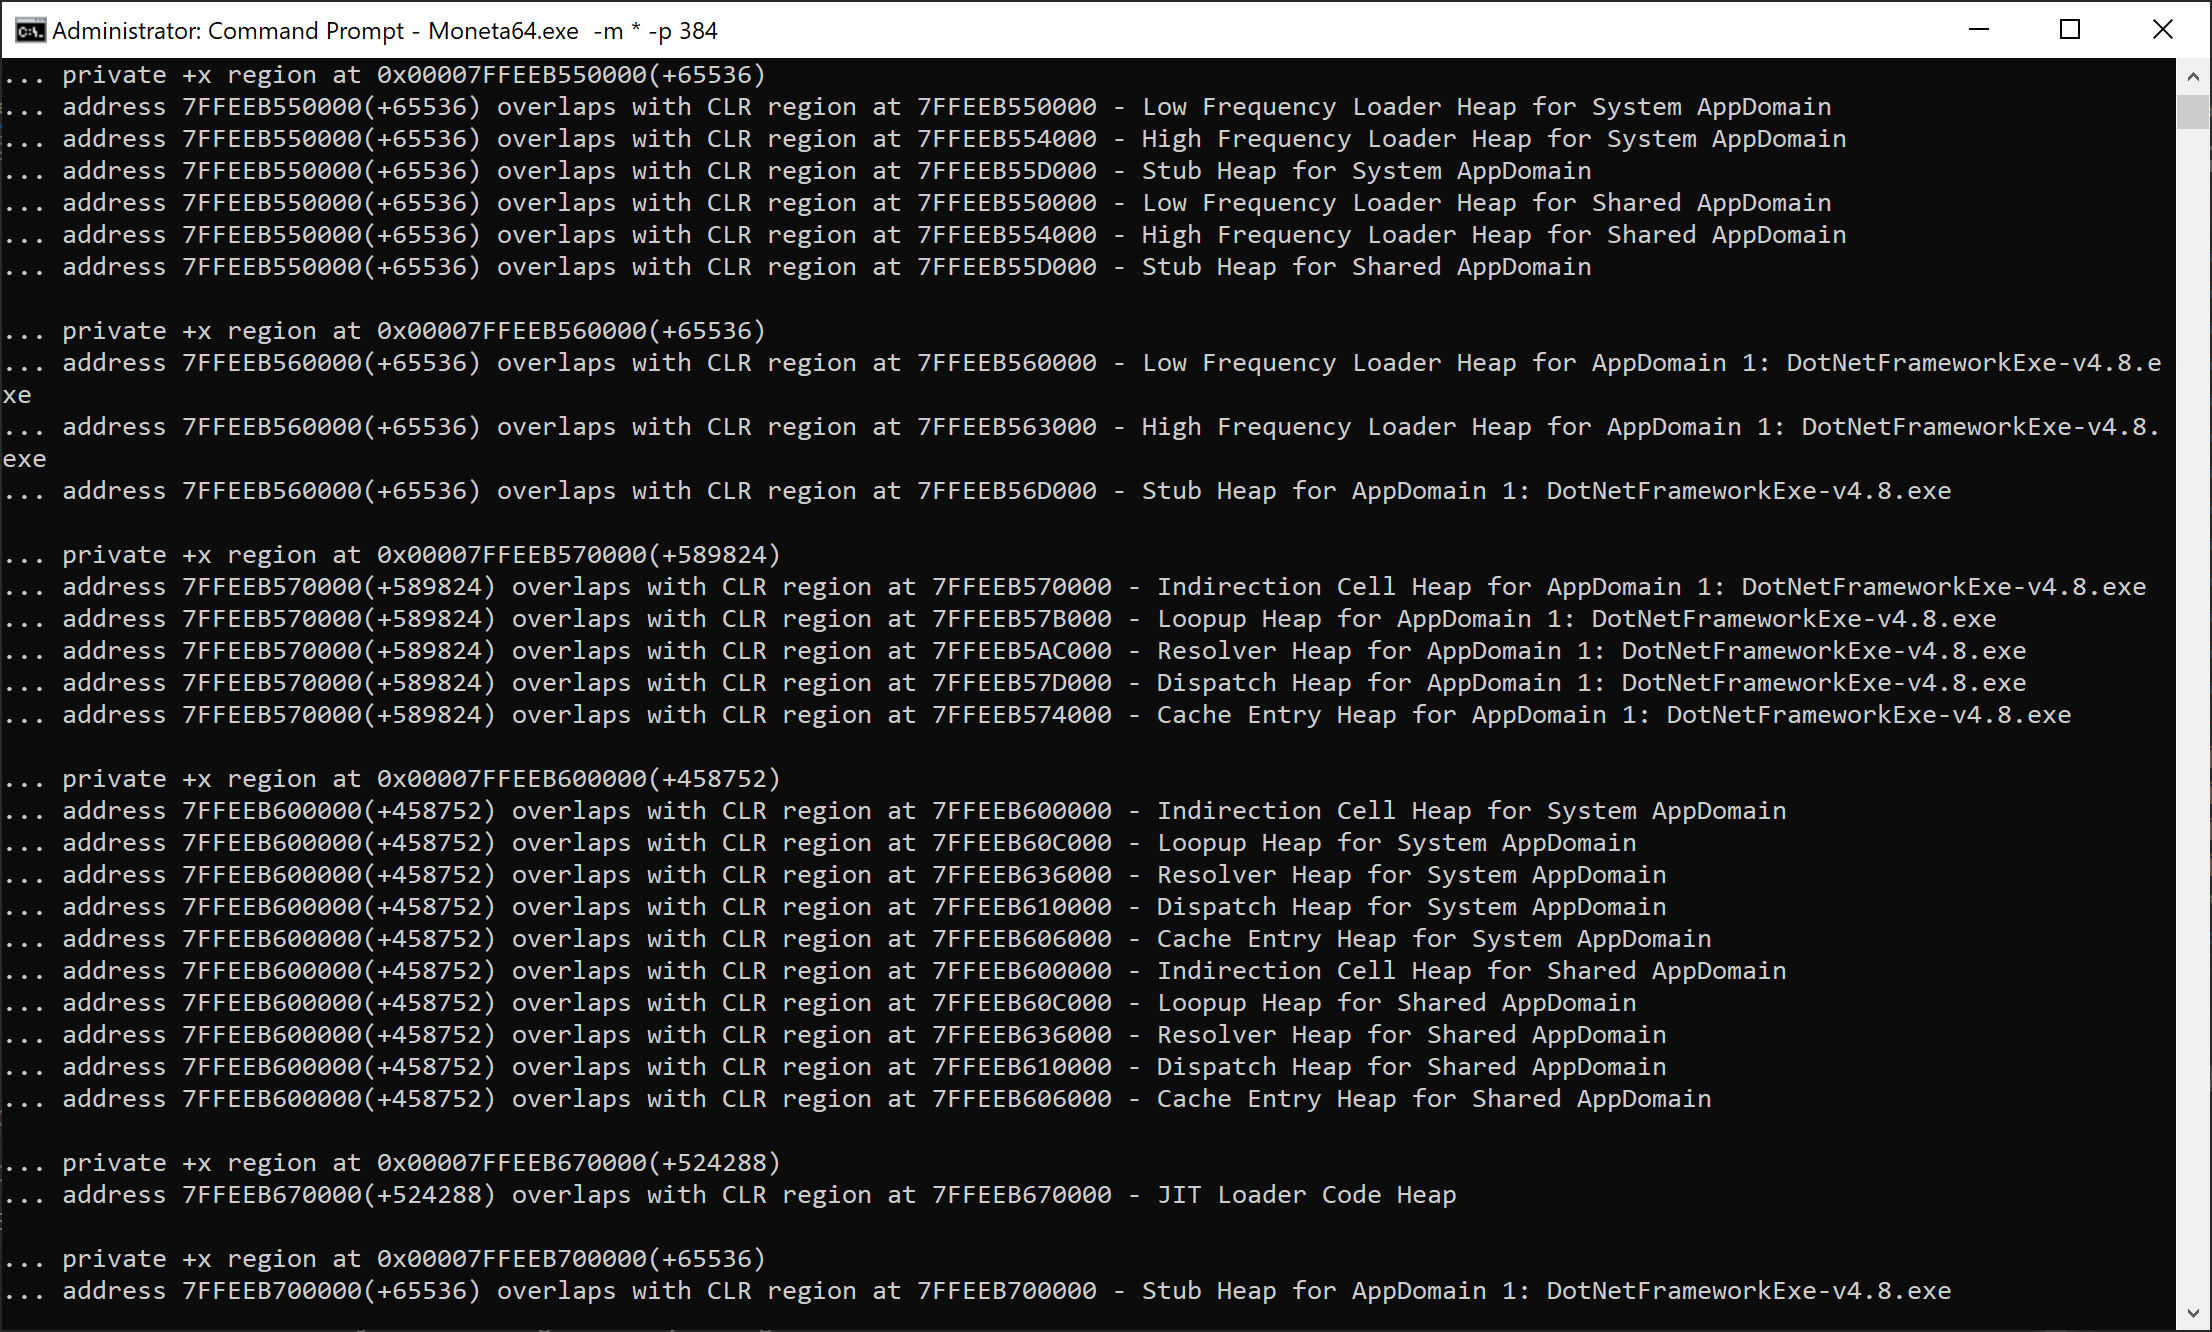
The results, seen above in Figure 28, show that these private +RWX regions correspond to the low frequency loader, high frequency loader, stub, indirection call, lookup, resolver, dispatch, cache entry and JIT loader heaps associated with all of the App Domains of the .NET process. In the case of this test EXE, this is only the System and Shared App Domains (which are present in all .NET environments) along with the App Domain corresponding to the main EXE itself. For a further explanation of App Domains and how managed assemblies are loaded, I suggest reading XPN’s blog or the Microsoft documentation on the topic.
Despite the high rate of correlation, it was not 100%. There were consistently two or more private +RWX regions in every .NET process I analyzed that could not be accounted for using ClrMD. After a great deal of reversing and even manually fixing bugs in ClrMD, I came to the conclusion that the documentation on the topic was too poor to fix this problem short of reversing the entire CLR, which I was not willing to do. There seems to be no existing API or project (not even one written by Microsoft) which can reliably parse the CLR heap and enumerate its associated memory regions.
With this path closed to me, I opted for a more simplistic approach to the issue, instead focusing on identifying references to these +RWX regions as global variables stored within the .data section of clr.dll itself. This proved to be a highly effective solution to the problem, allowing me to introduce a whitelist filter for the CLR, which I called clr-prvx.
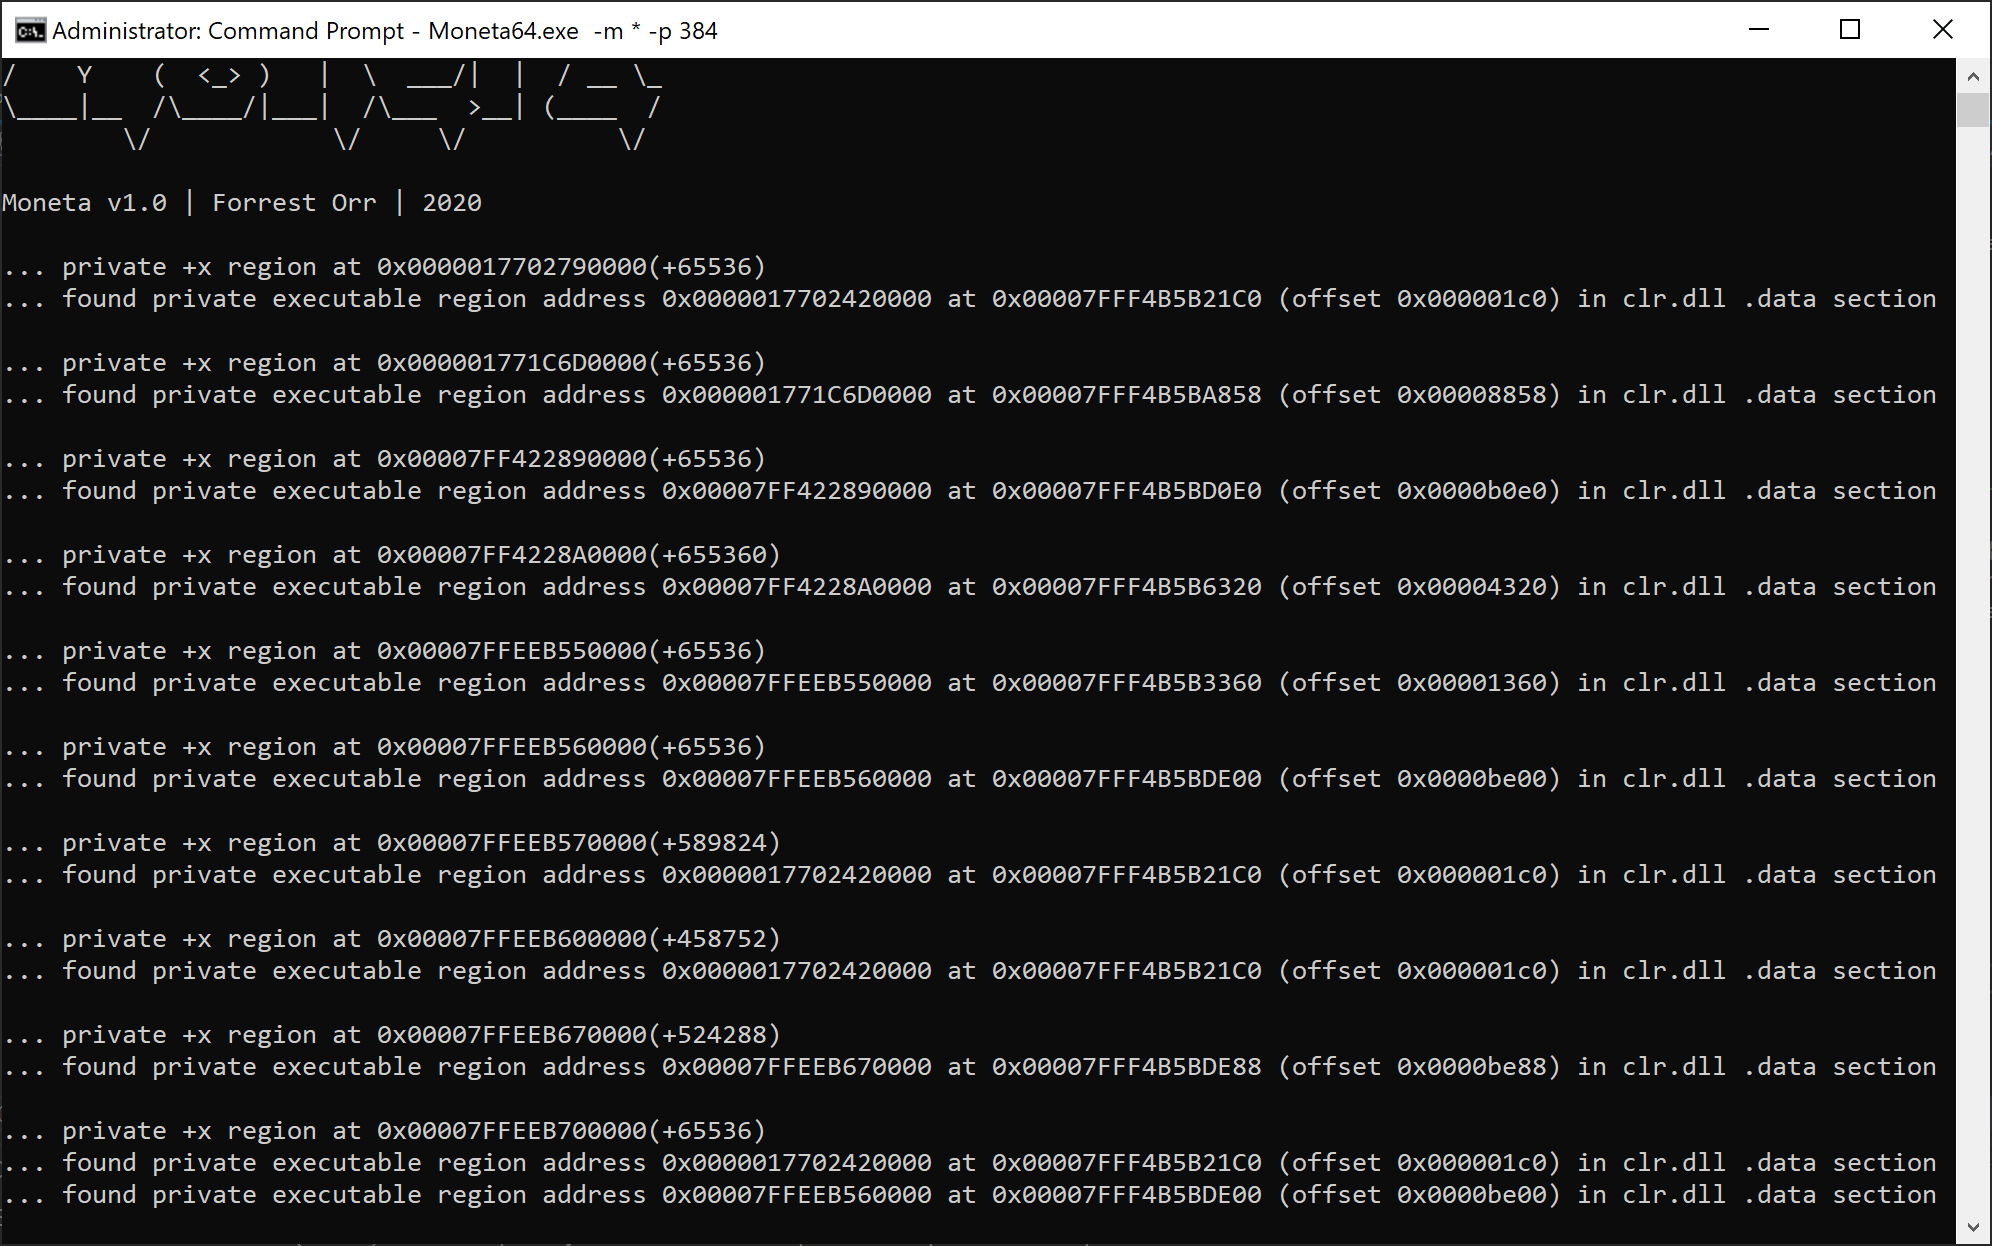
Notably, in older versions of the .NET framework, the mscorwks.dll module will be used for CLR initialization rather than clr.dll and will thus contain the references to globals in its own .data section. The only additional criteria needed to apply this CLR whitelist filter is to confirm that the process in question has had the CLR initialized in the first place. I discovered a nice trick to achieve this in the Process Hacker source code through use of a global section object, a technique which I adapted into my own routine used in Moneta.
int32_t nDotNetVersion = -1;
wchar_t SectionName[500] = { 0 };
static NtOpenSection_t NtOpenSection = reinterpret_cast<NtOpenSection_t>(GetProcAddress(GetModuleHandleW(L"ntdll.dll"), "NtOpenSection"));
static RtlInitUnicodeString_t RtlInitUnicodeString = reinterpret_cast<RtlInitUnicodeString_t>(GetProcAddress(GetModuleHandleW(L"ntdll.dll"), "RtlInitUnicodeString"));
UNICODE_STRING usSectionName = { 0 };
HANDLE hSection = nullptr;
OBJECT_ATTRIBUTES ObjAttr = { sizeof(OBJECT_ATTRIBUTES) };
NTSTATUS NtStatus;

_snwprintf_s(SectionName, 500, L"\\BaseNamedObjects\\Cor_Private_IPCBlock_v4_%d", dwPid);
RtlInitUnicodeString(&usSectionName, SectionName);
InitializeObjectAttributes(&ObjAttr, &usSectionName, OBJ_CASE_INSENSITIVE, nullptr, nullptr);
NtStatus = NtOpenSection(&hSection, SECTION_QUERY, &ObjAttr);

if (NT_SUCCESS(NtStatus)) {
  nDotNetVersion = 4;
  CloseHandle(hSection);
}
else if (NtStatus == 0xc0000022) { // Access denied also implies the object exists, which is all I care about.
  nDotNetVersion = 4;
}
if (nDotNetVersion == -1) {
ZeroMemory(&usSectionName, sizeof(usSectionName));
ZeroMemory(&ObjAttr, sizeof(ObjAttr));
hSection = nullptr;

_snwprintf_s(SectionName, 500, L”\\BaseNamedObjects\\Cor_Private_IPCBlock_%d”, dwPid);
RtlInitUnicodeString(&usSectionName, SectionName);
InitializeObjectAttributes(&ObjAttr, &usSectionName, OBJ_CASE_INSENSITIVE, nullptr, nullptr);
NtStatus = NtOpenSection(&hSection, SECTION_QUERY, &ObjAttr);

if (NT_SUCCESS(NtStatus)) {
nDotNetVersion = 2;
CloseHandle(hSection);
}
else if (NtStatus == 0xc0000022) {
nDotNetVersion = 2;
}
}
Private +RWX regions resulting from the CLR explain only a limited portion of the dynamic code which can appear as false positives. To describe them all is beyond the scope of this post, so I’ll focus on one last interesting category of such memory – the +RWX regions associated with image mappings.
Although a rarity, some PEs contain +RWX sections. A prime example is the previously discussed clr.dll, a module which will consistently be loaded into processes targeting .NET framework 4.0+.
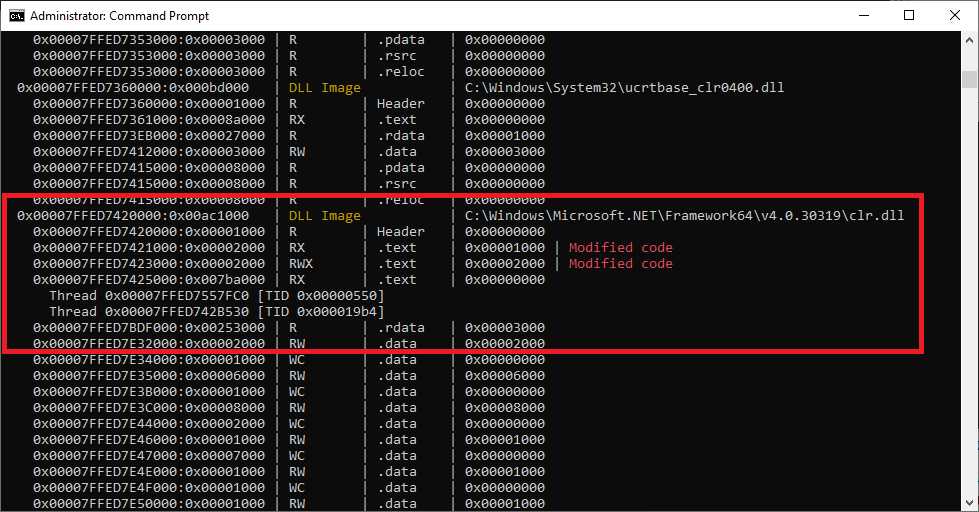
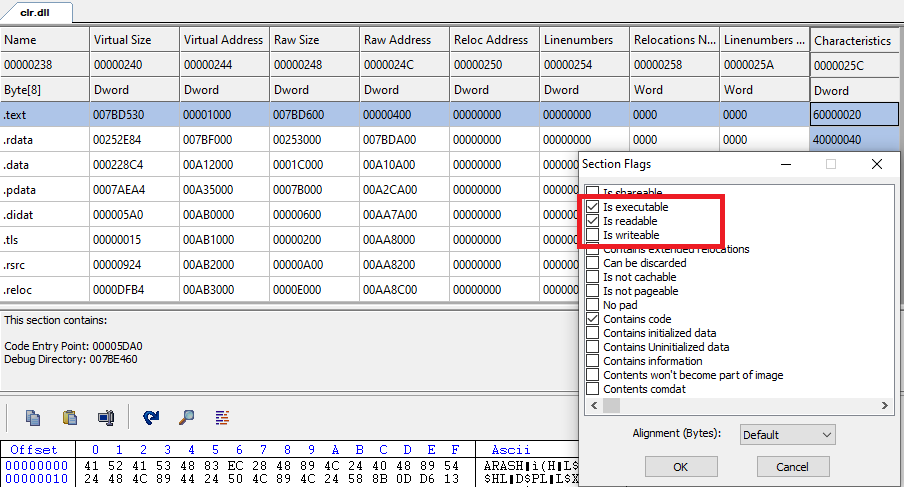
The phenomena displayed above is a consistent attribute of clr.dll, appearing in every process where the CLR has been initialized. At 0x00007FFED7423000, two pages (0x2000 bytes) of memory have been privately paged into the host process where an isolated enclave within the .text section has been made writable and modified at runtime. Interestingly, these +RWX permissions are not consistent with the clr.dll PE headers on disk.
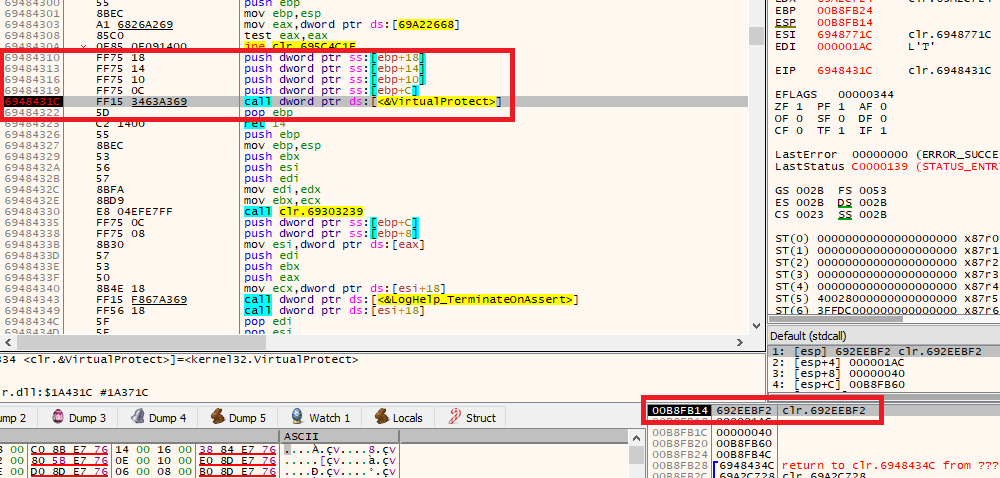
This region is manually modified by CLR.DLL!_CorExeMain as part of the CLR initialization discussed earlier via a call to KERNEL32.DLL!VirtualProtect.
These types of dynamic +RWX image regions are rare and tend to stem from very specific modules such as clr.dll and mscorwks.dll (the legacy version of clr.dll, which contains a +RWX section called .xdata). This makes them easy to classify as false positives, but also easy places for malware and exploits to hide their dynamic code in.
Last Thoughts
With fileless malware becoming ubiquitous in the Red Teaming world, dynamic code is a feature of virtually every single “malware” presently in use. Interestingly, the takeaway concept from this analysis seems to be that attempting to detect such memory is nearly impossible with IOCs alone when the malware writer understands the landscape he is operating in and takes care to camouflage his tradecraft in one of the many existing abnormalities in Windows. Prime among these being some of the false positives discussed previously, such as the OS-enacted DLL hollowing of User32.dll in Wow64 processes or the +RWX subregions within CLR image memory. There were far too many such abnormalities to discuss within the scope of this text alone and the list of existing filters for Moneta remains far from comprehensive.
Moneta provides a useful way for attackers to identify such abnormalities and customize their dynamic code to best leverage them for stealth. Similarly, it provides a valuable way for defenders to identify/dump malware from memory and also to identify the false positives they may be interested in using to fine-tune their own memory detection algorithms.
The remaining content in this series will be aimed at increasing the skill of the reader in bypassing existing memory scanners by understanding their detection strategies and exploring new stealth tradecraft as yet undiscussed.


