
Table of Contents
Introduction
This is the second post in my series and with this post we will focus on malware and some of their relevant detections. This post will focus on an interesting observation I made when creating my heap encryption and how this could be leveraged to detect arbitrary shellcode as well as tools like cobalt strike, how those detections could be bypassed and even newer detections can be made.
Sample code of a POC can be found here: https://github.com/waldo-irc/MalMemDetect
The First Detection
If you recall in the first post, our method at targeting Cobalt Strikes heap allocations was to hook the process space and manage all allocations made by essentially what was a module with no name. Here is the code we had used as a refresher:
#include
#pragma intrinsic(_ReturnAddress)

GlobalThreadId = GetCurrentThreadId(); We get the thread Id of our dropper!

HookedHeapAlloc (Arg1, Arg2, Arg3) {
    LPVOID pointerToEncrypt = OldHeapAlloc(Arg1, Arg2, Arg3);
    if (GlobalThreadId == GetCurrentThreadId()) { // If the calling ThreadId matches our initial thread id then continue

    	HMODULE hModule;
    	char lpBaseName[256];

		if (::GetModuleHandleExA(GET_MODULE_HANDLE_EX_FLAG_FROM_ADDRESS, (LPCSTR)_ReturnAddress(), &hModule) == 1) {
         	::GetModuleBaseNameA(GetCurrentProcess(), hModule, lpBaseName, sizeof(lpBaseName));
         }

        std::string modName = lpBaseName;
        std::transform(modName.begin(), modName.end(), modName.begin(),
                [](unsigned char c) { return std::tolower(c); });
        if (modName.find("dll") == std::string::npos && modName.find("exe") == std::string::npos) {
                     // Insert pointerToEncrypt variable into a list
        }
    }
}
The magic lines lie here:
if (::GetModuleHandleExA(GET_MODULE_HANDLE_EX_FLAG_FROM_ADDRESS, (LPCSTR)_ReturnAddress(), &hModule) == 1) {
	::GetModuleBaseNameA(GetCurrentProcess(), hModule, lpBaseName, sizeof(lpBaseName));
}
What we are trying to do here is take the current address our function will be returning to and attempting to resolve it to a module name using the function GetModuleHandleExA with the argument GET_MODULE_HANDLE_EX_FLAG_FROM_ADDRESS. With this flag the implication is the address we are passing is: “an address in the module” (https://docs.microsoft.com/en-us/windows/win32/api/libloaderapi/nf-libloaderapi-getmodulehandleexa). The module name will get returned and stored in the lpBaseName variable.
With the case of our thread – targeted heap encryption – this function actually returns nothing, as it cannot resolve the return address to a module! This also means lpBaseName ends up containing nothing.
As always, let’s see what this looks like in our debugger. First, we’ll start with a legitimate call. I’ve gone ahead and hooked HeapAlloc using MinHook (https://github.com/TsudaKageyu/minhook) and am tracing the return address of all callers. Let’s see who the first function to call our hooked malloc is:

fig 1. Usage of _ReturnAddress intrinsic
Here we can see within our code we use the Visual C++ _ReturnAddress() intrinsic (https://docs.microsoft.com/en-us/cpp/intrinsics/returnaddress?view=msvc-160) and store the value in a variable named “data”. We then pass this variable to GetModuleHandleExA in order to resolve the module name we will be returning to.

fig 2. Return address value
Taking a look at data we can see it seems to have stored a valid address. Now let’s look at this address in our disassembler.

fig 3. Return address location
As you can see we are right at that “mov rbx,rax” instruction at the end of the screenshot based on the address. That means when our hooked function completes, this is where it will return, and we can further validate this as the correct assembly instruction we will return to as right before this is a call to RtlAllocateHeap, our hooked function! Using this we now know we are in the function LdrpGetNewTlsVector, that our hooked RtlAllocateHeap was just ran, and on completion, it’ll continue within LdrpGetNewTlsVector right after the call as usual. If we attempt to identify what module this function comes from, we can clearly see it is from ntdll.dll.

fig 4. Return address module resolved
This works because the function maps to a DLL we appear to have loaded from disk. Because of this, Windows knows how to identify what module the function comes from. What about our shellcode though? Let’s see what that looks like.

fig 5. Shellcode return address and failed resolution
So our base name is empty because the function fails to resolve the address to a module. Let’s see what that address looks like in the disassembler:
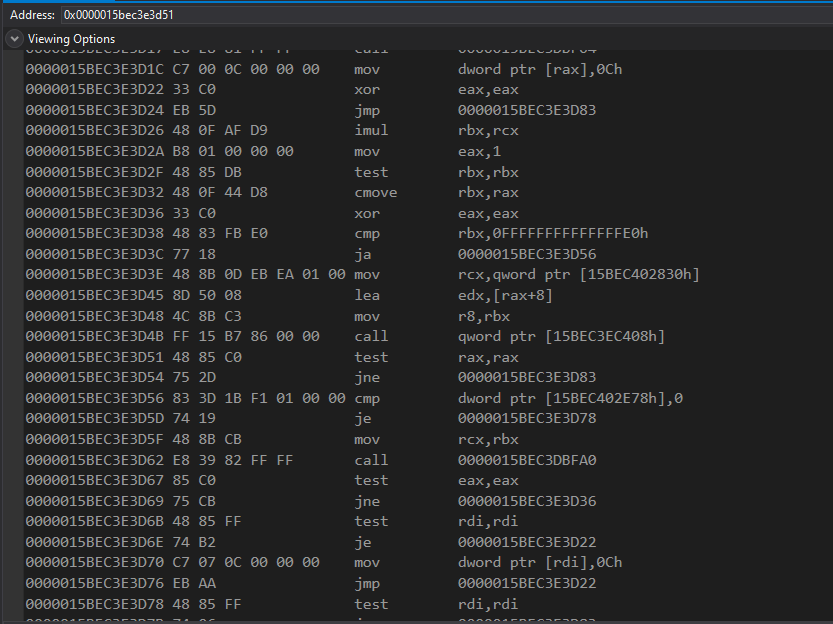
fig 6. Shellcode return address location
There’s our address at “test rax,rax”. We actually know this is our shellcode based on the address:
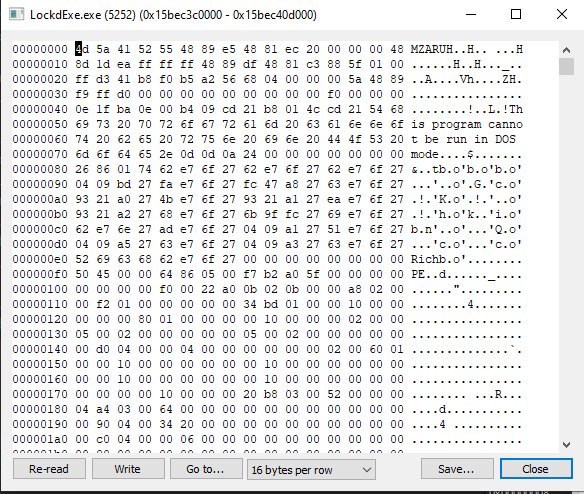
fig 7. Shellcode in process hacker
![]()
fig 8. Shellcode region in process hacker
Within process hacker we can see our MZ header and that the location we are returning to is within the address space of our shellcode. We can also see unlike other modules like ntdll.dll, in ProcessHacker the “use” column is empty for our shellcode:

fig 9. Use section for shellcode is empty
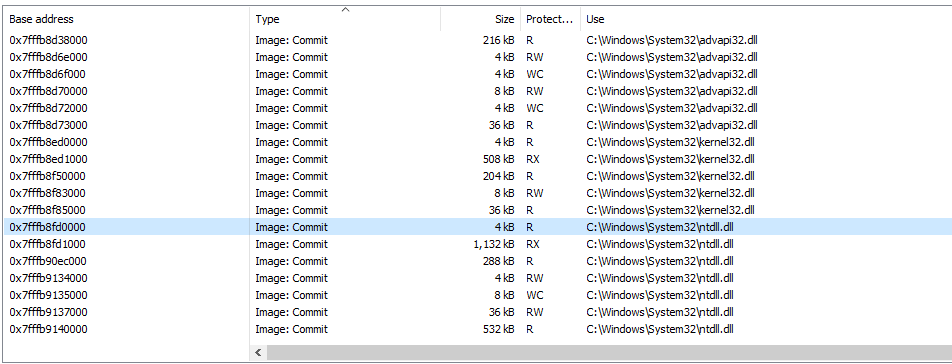
fig 10. Use section for DLLs is filled
This is because our arbitrarily allocated memory does not map to anything on disk. Because of this, when we attempt to resolve the return address to a module we get nothing returned as a result.
That being said, we can see instances of RWX memory that don’t map to disk in processes that use JIT compilers such as C# and browser processes as well. You can see in stage 3 of the Managed Execution Process (https://docs.microsoft.com/en-us/dotnet/standard/managed-execution-process) that an additional compiler takes the C# code a user creates and turns it into native code (which means our C# IL now becomes native assembly). For this process to take place a RWX region needs to be allocated for it to be able to write the new code and also be able to execute it. We can see these RWX regions in C# processes with ProcessHacker.
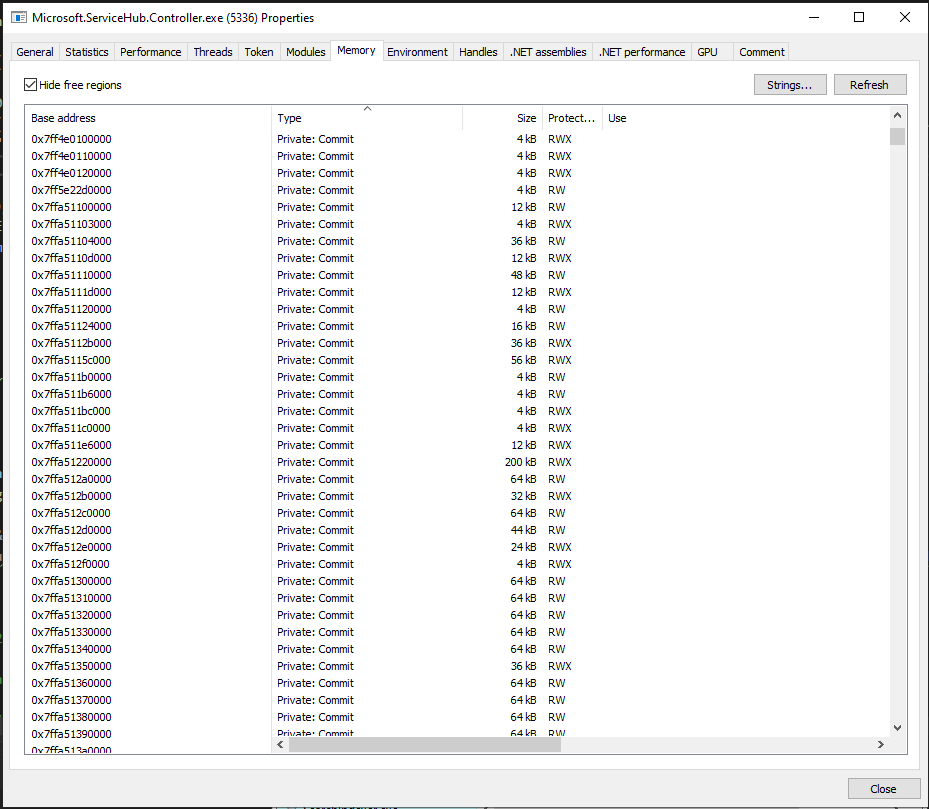
fig 11. JIIT Compiler RWX sections
Above you can see a small sample of these RWX sections within my Microsoft.ServiceHug.Controller.exe process. This means that in theory we could see false positives from JIT compiler-based languages that run any of our hooked functions from these memory regions. Additionally, this means these sorts of processes can also be great spaces to hide your RWX malware, as Private Commit RWX regions are otherwise considered suspicious (as we have executable memory that doesn’t map to anything on disk).
Outside of blending in with JIT processes though, let’s discuss another simple bypass to this, one that exists within Cobalt Strikes own C2 profile even.
The Module Stomp Bypass
If we think back to the original detection, we were able to observe executablememory calling our hooked functions that couldn’t resolve to any module name. A first thought may be “what is a mechanism to bypass this” as one must exist. Several exist in fact, but we can start with a simple one, a mechanism called “Module Stomping” (https://www.forrest-orr.net/post/malicious-memory-artifacts-part-i-dll-hollowing as well as https://www.ired.team/offensive-security/code-injection-process-injection/modulestomping-dll-hollowing-shellcode-injection).
What this technique effectively does is load a DLL that our process doesn’t currently have loaded and hollow out its memory regions to contain the data for a malicious DLL of ours instead. This would make it so all our calls now appear to be coming from this legitimate module!
The section in your malleable C2 profile (for Cobalt Strike) that you would have to edit is the following:
set allocator "VirtualAlloc";  # HeapAlloc,MapViewOfFile, and VirtualAlloc.

# Ask the x86 ReflectiveLoader to load the specified library and overwrite
#  its space instead of allocating memory with VirtualAlloc.
# Only works with VirtualAlloc
set module_x86 "xpsservices.dll";
set module_x64 "xpsservices.dll";
These settings can be observed in the old reference profile here: https://github.com/rsmudge/Malleable-C2-Profiles/blob/master/normal/reference.profile. By changing your allocator to “VirtualAlloc” and enabling the set module_x86 and x64 settings you can now allocate your Cobalt Strike payload to arbitrary modules you load instead of arbitrarily allocated executable memory space.
Let’s change the setting and see what this looks like. We will simply run an unstaged Cobalt Strike EXE and observe for this experiment.
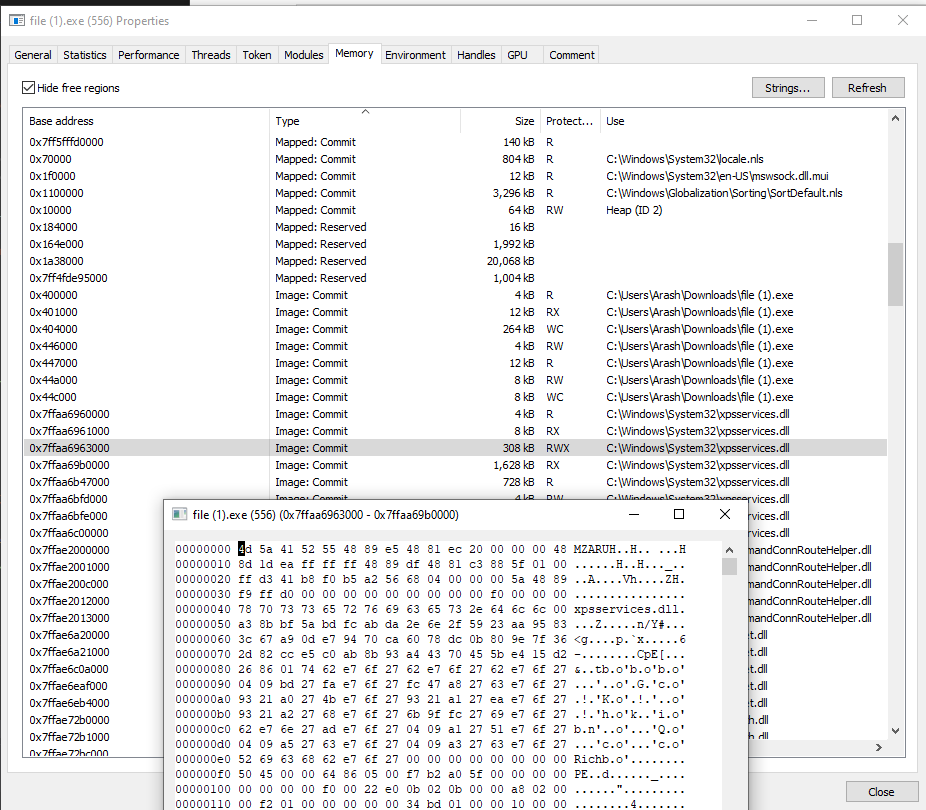
fig 12. Cobalt Strike module stomp
Let’s go ahead and run this with our module name resolver and see what it looks like. Since the name should always resolve, now we will change the logic a bit to monitor only xpsservices.dll.
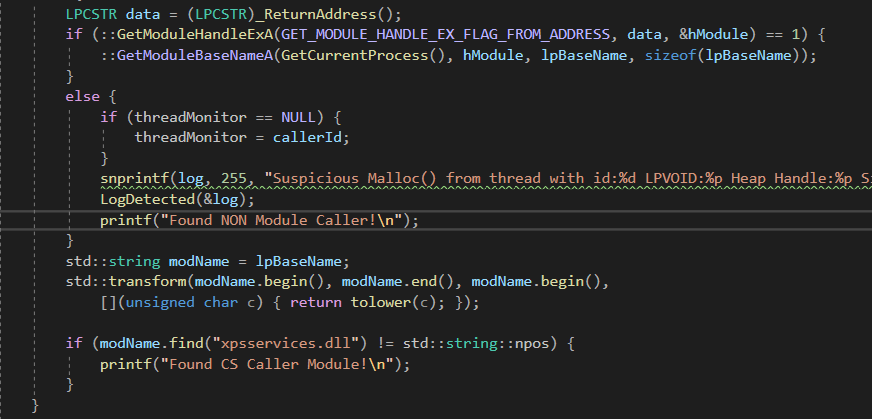
fig 13. New code to monitor xpsservices
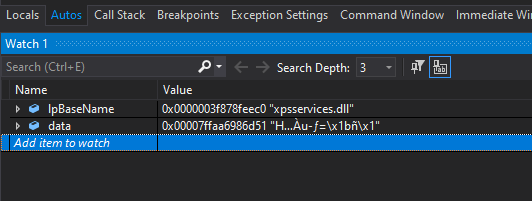
fig 14. Name resolved properly
Here we can see the new stomped DLL calling our hooked malloc, and that our code can successfully resolve calls to this module. If we look at the print statements, we would also see all the calls – from anything that doesn’t map to modules that have disappeared.
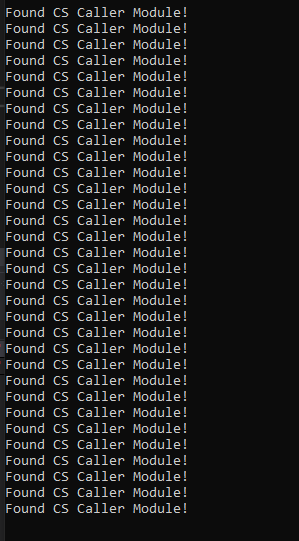
fig 15. Only module callers
And finally, we can see in the above screenshot that no callers without module names are observed anymore as all of Cobalt Strike’s calls now map to a module on disk, a simple bypass. So now we ask if this technique can be detected as well, and of course, there’s a few ways.
The Module Stomp Detection
There are several detections, but we will delve into two here for module stomping. One is due to a side effect of how Cobalt Strike implements module stomping as well as general IOCs that can be observed when module stomping is performed.
The first is a detection created by Slaeryan (https://github.com/yusufqk/DetectCobaltStomp). In short, this detection works because a side effect of Cobalt Strike’s implementation is that when loaded in memory, the region appears to be marked as a EXE internally and not a DLL. For those that don’t have cobalt strike, he also created a tool to mimic the implementation for people to play with and observe the detection. I won’t go into this one too much as he already has a POC and discusses this detection.
The other detection is a much more basic one. Within any executable file, the section where executable code lives is the .TEXT section. If we walk the .TEXT section of a DLL on disk and compare it to the .TEXT section of its equivalent offload in memory the sections in theory should always match, as the code should not change unless the file is polymorphic. The code for this is fairly basic.
HMODULE lphModule[1024];
DWORD lpcbNeeded;
// Get a handle to the process.
HANDLE = hProcess = OpenProcess(PROCESS_QUERY_INFORMATION |
	PROCESS_VM_READ,
	FALSE, processID);

// Get a list of all the modules in this process.
if (EnumProcessModules(hProcess, lphModule, sizeof(lphModule), &lpcbNeeded))
{
	for (i = 0; i < (lpcbNeeded / sizeof(HMODULE)); i++)
	{
		char szModName[MAX_PATH];

		// Get the full path to the module's file.

		if (K32GetModuleFileNameExA(hProcess, lphModule[i], szModName,
			sizeof(szModName) / sizeof(char)))
		{
			// Do stuff
		}
	}
}
Here we simply start by iterating every module in the process.
// Get file Bytes
FILE* pFile;
long lSize;
//SIZE_T lSize;
BYTE* buffer;
size_t result;
pFile = fopen(szModName, "rb");
// obtain file size:
fseek(pFile, 0, SEEK_END);
lSize = ftell(pFile);
rewind(pFile);
// allocate memory to contain the whole file:
buffer = (BYTE*)malloc(sizeof(BYTE) * lSize);
// copy the file into the buffer:
result = fread(buffer, 1, lSize, pFile);
fclose(pFile);

BYTE* buff;
buff = (BYTE*)malloc(sizeof(BYTE) * lSize);
_ReadProcessMemory(hProcess, lphModule[i], buff, lSize, NULL);

PIMAGE_NT_HEADERS64 NtHeader = ImageNtHeader(buff);
PIMAGE_SECTION_HEADER Section = IMAGE_FIRST_SECTION(NtHeader);
WORD NumSections = NtHeader->FileHeader.NumberOfSections;
for (WORD i = 0; i < NumSections; i++) { std::string secName(reinterpret_cast(Section->Name), 5);
	if (secName.find(".text") != std::string::npos) {
		break;
	}
	Section++;
}
We then load the relevant module file on disk and store the bytes for comparing memory in the var buffer. We then also read from the base address of the module located in “lphModule[i]” and store all the bytes within the var buff. We then enumerate all the sections in the loaded module until we find the .TEXT section and break the loop. At this point the “Section” variable will contain all our relevant section data.
To be able to match the on-disk file to the one in memory we need to use the Section offsets to find the .TEXT section location on disk and in memory. This actually will not match (usually). The offset to the .TEXT section in memory generally gets relocated down a page, 4096 bytes. The offset to the section on disk is usually 1024 bytes in comparison. But we say usually so we of course will simply use “Section->PointerToRawData” to get the offset on disk and “Section->VirtualAddress” to get its offloaded address in memory to be 100% sure.
LPBYTE txtSectionFile = buffer + Section->PointerToRawData;
LPBYTE txtSectionMem = buff + Section->VirtualAddress;
At this point all you’d have to do is compare each memory region byte for byte and make sure they match.
int inconsistencies = 0;
for (int i = 0; i < Section->SizeOfRawData; i++) {
	if ((char*)txtSectionFile[i] != (char*)txtSectionMem[i]) {
		inconsistencies++;
	}
}
Now of course we need to account for things like hooks and such, as we know many AV and EDR will perform hooks, we know these will provide false positives. As a result we take the amount of the differences and if it’s greater than a certain number only then do we get concerned.
if (inconsistencies > 10000) {
	printf("FOUND DLL HOLLOW.\nNOW MONITORING: %s with %f changes found. %f%% Overall\n\n", szModName, inconsistencies, icPercent);
	CHAR* log = (CHAR*)malloc(256);
	snprintf(log, 255, "FOUND DLL HOLLOW.\nNOW MONITORING: %s with %f changes found. %f%% Overall\n\n", szModName, inconsistencies, icPercent);
	LogDetected(&log);
	free(log);
	std::string moduleName(szModName, sizeof(szModName) / sizeof(char));
	std::transform(moduleName.begin(), moduleName.end(), moduleName.begin(),
		[](unsigned char c) { return tolower(c); });
	dllMonitor = moduleName;
	break;
}
We arbitrarily pick 10,000 as our amount, simply because we know it’ll certainly be a larger number than any number of hooks any utility would alter for the hooks, as well as being small enough as we know most raw malware payloads at least are much bigger. This should reduce false positives substantially while finding any altered DLLs in memory. The only caveat to this would be additional false positives from polymorphic DLLs who alter themselves in memory.
Let’s run our new detector against our Cobalt Strike payload and the hollowed DLL and observe the results.
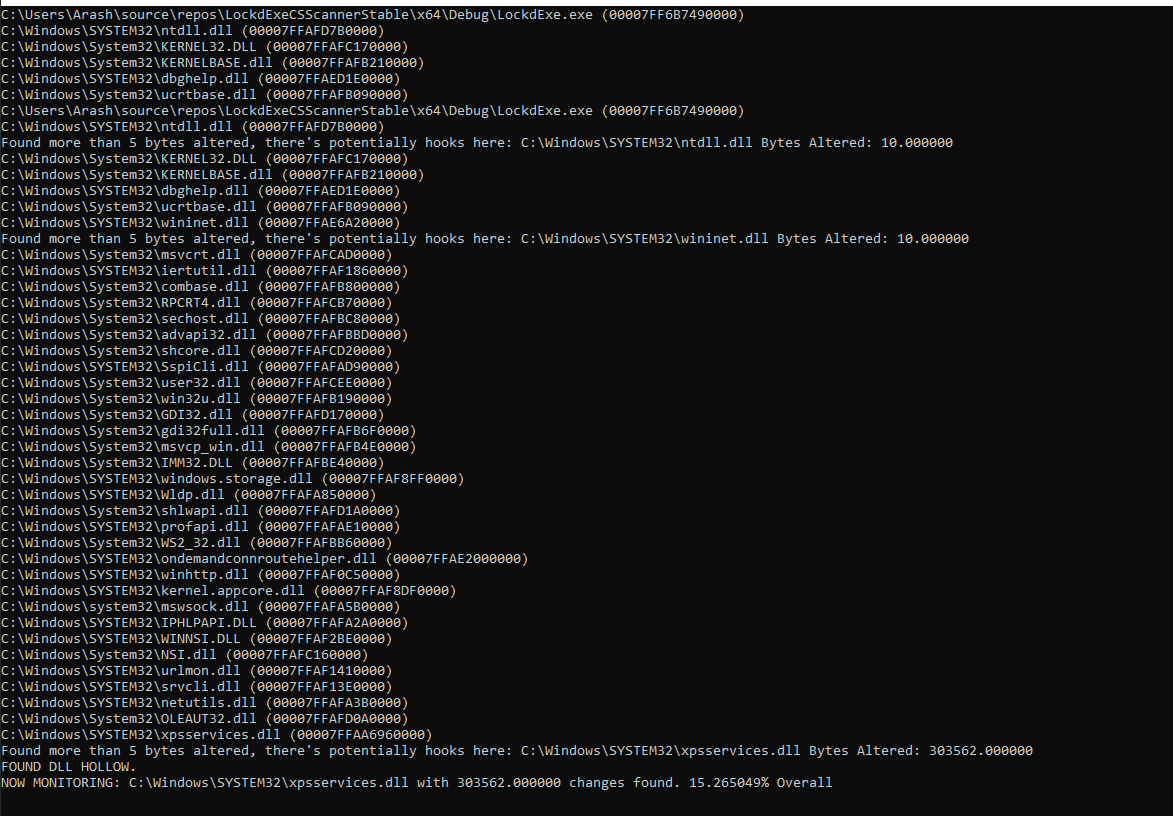
fig 16. DLL Hollow Detection
Here we can see a few false positives from our own hooks actually, where we alter five bytes to the prologue of each function, two functions being altered in each DLL. Finally at the end we can see our hollowed xpsservices.dll and the detection is observed with over 300k bytes altered.
Let’s go ahead and turn our tool into a DLL and inject it into everything to observe false positives:
By injecting into everything and logging all data to files we can observe our detection:
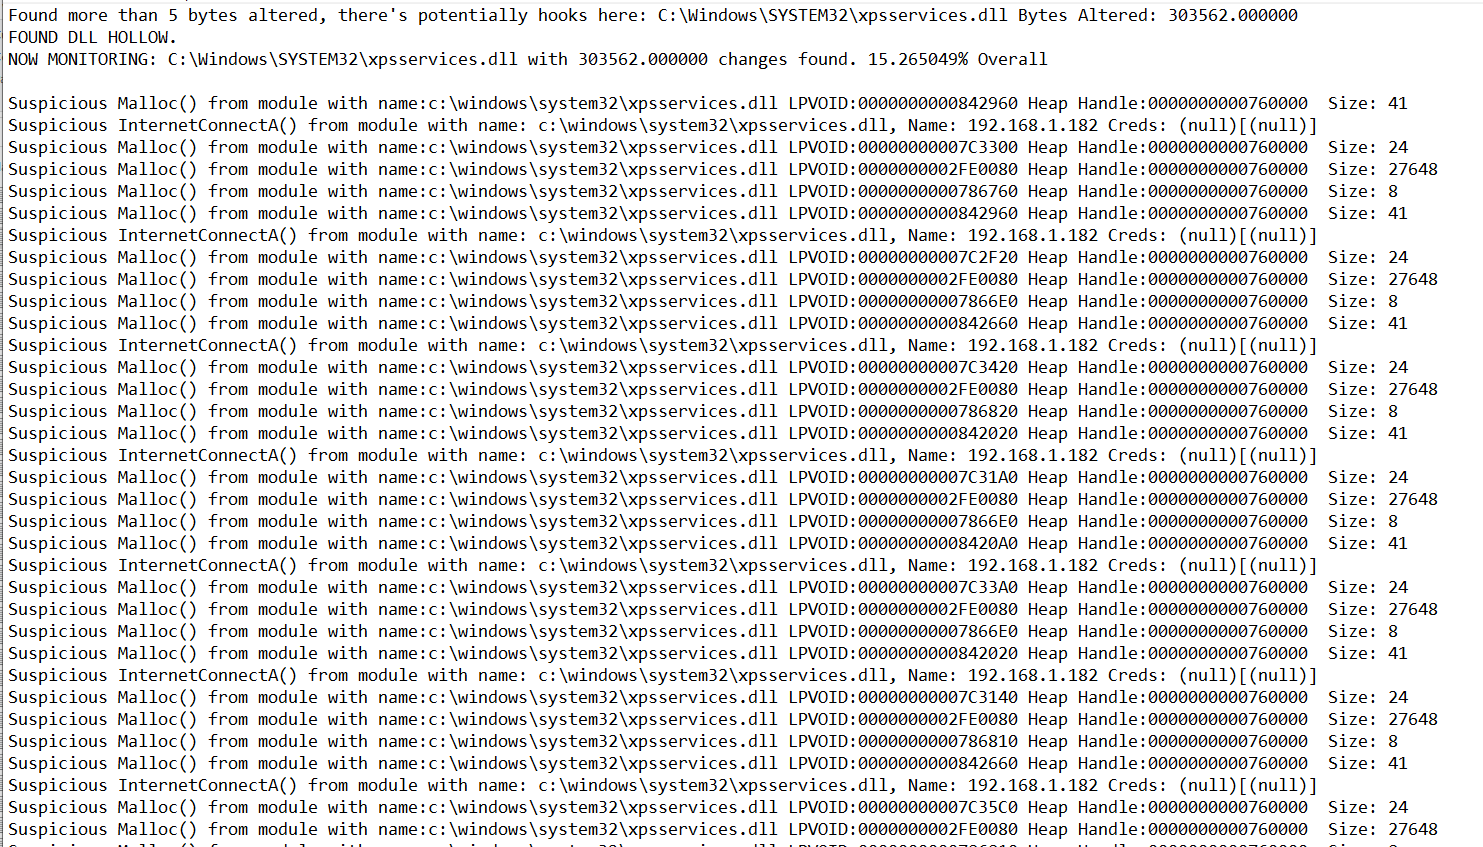
fig 17. Detection
BUT! Interestingly enough we do observe one false positive on what appears to be a polymorphic DLL after all…

fig 18. False positive
Unfortunately not enough bytes are altered to be useful for a hollow target though!
How do you bypass this detection? Now the simple obvious solution is to restore the DLL bytes (per https://twitter.com/solomonsklash‘s idea) on sleep to prevent this sort of detection and next steps would be hooking those calls and detecting the restores, if possible, or the constant file reads etc. As we all know, cybersecurity is a never-ending cat and mouse.
Final Thoughts
As red teamers work on malware, often we make discoveries that can lead to new detections too. These observations can be tremendously useful to the community while also pushing researchers to the cutting edge and forcing them to think outside of the box if they’d like this game to continue longer.
As we’ve seen above, we find detections, make bypasses, find more detections — and the game will never end. Hopefully some interesting new insights could be made to make our defensive industry far more robust overall, as we work together towards a goal of secure internet usage.


